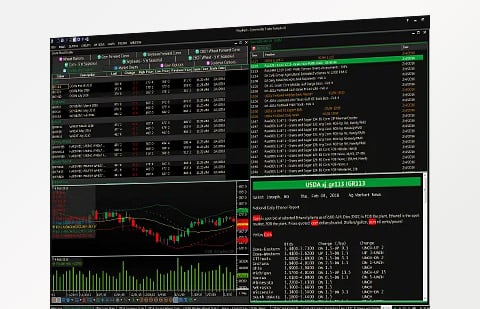
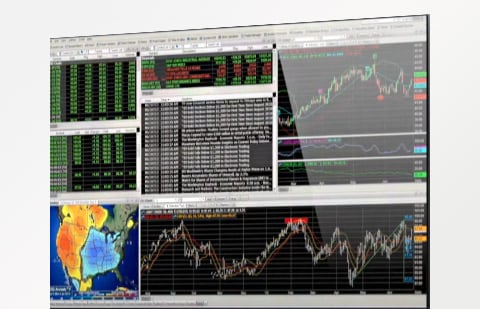
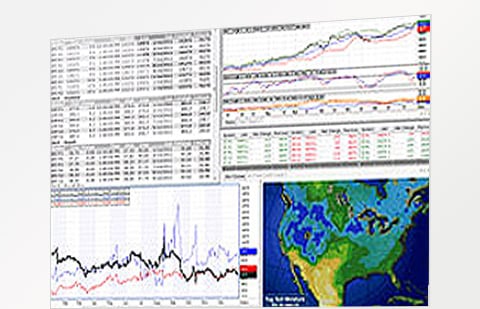
The Best Trading Platform is the one YOU like best! AMP Futures offers you 50+ Trading Platforms. Compare and Choose the Best Trading Platform for YOU!
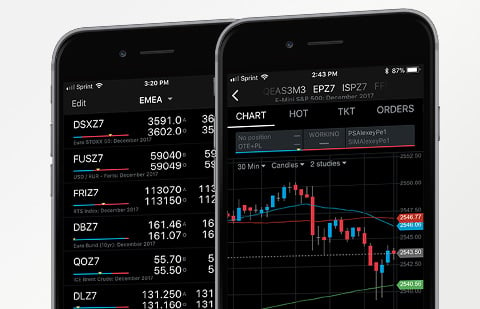
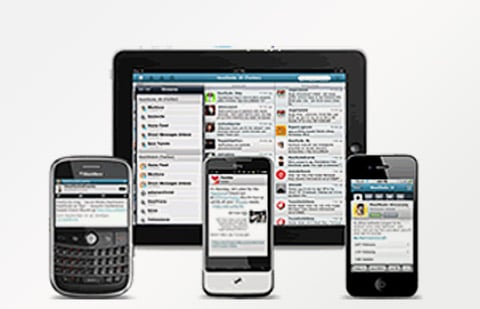
ALLFREECQGRITHMICTTOPTIONSMOBILE (iOS/Android)
We will beat or match any commissions quote! Or get 20 Commission-FREE trades!


.png)