
Good Friday Holiday Trading Schedule (2024)
From the CME Globex Control Center, here is the summary of KEY changes, per CME market segment Thursday March 28, 2024...
![]()
MultiCharts .NET combines the best features of MultiCharts with the robust potential of the .NET framework. Engineered specifically for programmers, users can create strategies and indicators in C# and VB.NET. Watch a short intro video to get an overview of the .NET Editor and tight integration we created with Visual Studio. Remember, you can choose between 32 and 64-bit versions for the one that suits your needs best.
AMP's FREE Version of MultiCharts is limited to LIVE accounts only.
Funded Accounts can use AMP's FREE Version in LIVE or Unlimited Paper Trading (DEMO) Mode
2012 t2w Members’ Choice Award
2011 t2w Members’ Choice Award
2013, 2015 Technical Analysis of Stocks and
2012 BMT Best Of Trading Award

MultiCharts .NET’s advantage is based on building robust trading strategies in C# and VB.NET, accurate market data with minimal delivery time, order execution within milliseconds, and lower-than-average transaction fees. With tools such as high-definition charting, technical indicators, backtesting, and strategy execution, everything you need is at your fingertips.
Complete and powerful strategy backtesting
You can easily and quickly develop and backtest a strategy before you invest real money. You can test it on historical data as if you were doing market replay. You can make sure that your strategy is not a result of optimized curve fitting—your strategy actually provides a fundamental advantage. Here is extra information on strategy backtesting.
Data feeds for anyone’s needs
You can choose the quickest or most economical data feed depending on what you are trying to achieve. Professionals have the option to use Bloomberg as the data feed of choice, while beginner traders can choose IQFeed as an economical data feed with good quality data. Traders who do high-frequency trading can access CQG, which provides some of the fastest, real-time quotes. Click on the link to see all of the supported data feeds.
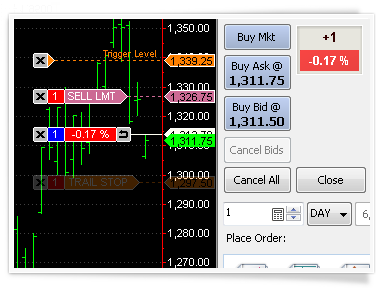
Precision and speed with automated trading
Even with a winning strategy, just a short delay in order execution can make all the difference. After developing a strategy, the next step is to actually send the orders. The key advantage of automated trading is that it can send orders a lot faster than a human being, and this can give you an advantage over the competition.
Chart Analysis
Charting is one of the most important aspects of trading software. You need to see precise price movements to determine your next move. Charting software needs to be flexible, so that you can adjust any part of it to your particular needs. Charts also need to be reliable, so that you don’t experience any hold-ups or crashes while analyzing important information. We have thought about all of this while building MultiCharts .NET.
MultiCharts .NET’s strength is in its features, flexibility, and commitment to following industry programming standards. MultiCharts .NET provides all the necessary features you may need in a trading platform. Our features allow you to create sophisticated trading strategies for your trading. Our flexibility allows you to choose the optimal data vendors and execution gateways. MultiCharts .NET is designed for building robust strategies and indicators in C# and VB.NET.
Powerful flexibility of C# and VB.NET
MultiCharts .NET combines the professional .NET framework with best features found in regular MultiCharts. There are many advantages for professional programmers in using .NET, simply because it’s so robust. Features that are possible in MultiCharts .NET, and not available in regular MultiCharts, include: access to all data directly from scripts, for instruments that are not even charted; creation of custom toolbars, ability to draw objects using GDI, and access to all information in the Order and Position Tracker from scripts.
Don’t reinvent the wheel
With MultiCharts .NET you do not need to reinvent the wheel—you can simply find most information on the Internet. There is a large number of libraries available for free after a simple web search. For example, let’s say you want to pass information from MultiCharts to Excel and from Excel to MultiCharts. The answer is—it’s already been done for you. To sum it up, with MultiCharts you automatically get access to a wealth of resources, and you can focus on creating something new—as opposed to spending time on translation into yet another language.
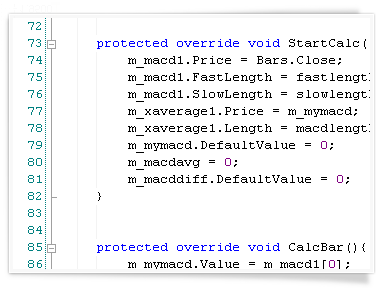
Got an idea for trading the markets? First you need to check its validity, which requires programming the idea as a set of rules.
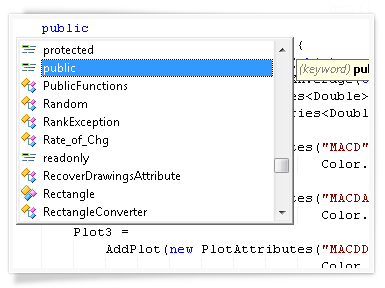
MultiCharts .NET was engineered specifically for experienced programmers. C# is a powerful and flexible language, which allows you to express pretty much any idea. VB.NET is also available.
C# and VB.NET are powerful and flexible languages
VB.NET and C# are often preferred by professional programmers for trading strategy development. Complex scripts can be managed more easily than in some other languages through creation of classes and declaring members and methods within them.
MultiCharts .NET allows you to build your strategy out of many trading signals. You can use pre-built examples, or program your own. For example, you can make a strategy by combining the built-in Channel Breakout Long Entry with a Profit Target Long Exit.
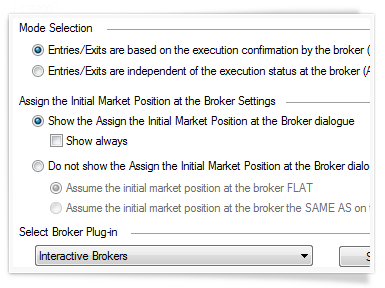
Strategy logic can take into account new events (new market data) and changes in market position at the broker. A strategy can take both into account at the same time, resulting in a complete picture.
Strategies based on market data
Usually strategies are calculated based on the arrival of new market data, which is quite logical since strategies must monitor changes in the market and react to those changes. MultiCharts .NET can recalculate a strategy on every tick, on a bar close, or based on a user-defined timer.
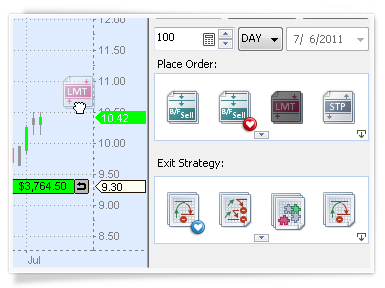
Strategies based on broker events
Sometimes changes in a brokerage account need to be considered during automated trading. Trading strategies in MultiCharts .NET can also react to changes in market position and be triggered at a particular level.
MultiCharts .NET lets you to use any IDE you like, from the built-in editor to Notepad++. A very tight integration with Visual Studio makes that IDE a perfect choice.
MultiCharts .NET’s architecture was optimized to deliver great efficiency.
Your computer’s processor governs speed
During optimization MultiCharts .NET uses all available cores on your computer, which results in a dramatic speed increase. For example, a 48-core computer will perform optimization 33 times faster than a single core.
Carefully crafted architecture for productivity
Our engineers spent hundreds of hours optimizing MultiCharts .NET’s architecture, resulting in greater productivity for MultiCharts .NET users.
.png?width=385&height=288&name=689_4155_Speed%20(1).png)
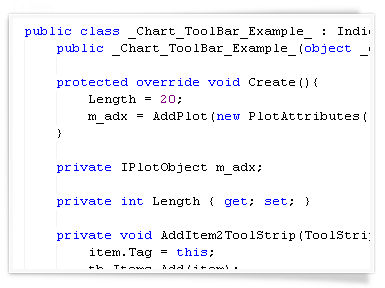
MultiCharts .NET was engineered specifically for programmers who use VB.NET and C#. The .NET framework has a more flexibility than PowerLanguage, with a few key features outlined below:
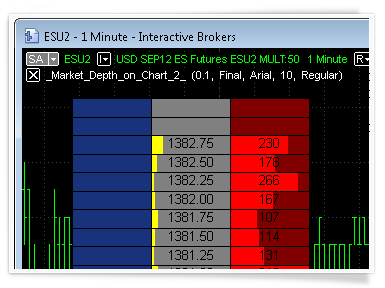
GDI lets you draw whatever you want with highest performance directly on charts. Even the most complex drawings, such as a complete DOM window with real-time quotes, are processed with ease.
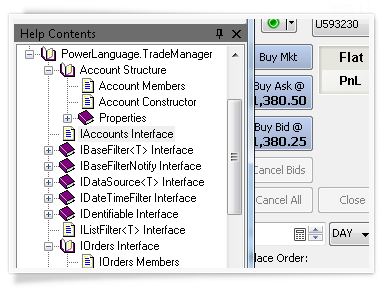
Quickly access all information fields from Order and Position Tracker, such as account name, number, PnL and complete information about your orders. You can also send unmanaged orders directly from scripts.
If existing toolbars are not enough, you can easily create custom ones to suit your needs.
Your indicators and strategies can access data for symbols that are not even charted, giving you maximum flexibility when making trading decisions.
.png?width=385&height=288&name=1689_689_9654_eureka1-1%20(1).png)
Charting is one of the most important aspects of MultiCharts .NET. You need to see precise price movements to determine your next move. Charting software needs to be flexible, so that you can adjust any part of it to your particular needs. The new 64-bit version of MultiCharts lets you easily view charts of any length, limited only by the amount of memory in your computer. For technical information on this feature look at the related Wiki page.
To make the right choice it is equally important to see the small details and the big picture. In MultiCharts .NET, you can easily perform multi time frame analysis without external DLLs and global variables.
Several data series in different resolutions
Working with several data series is one of the main features in MultiCharts .NET. There is no need for cumbersome workarounds—you can simply add several price series into one chart window. The trading platform allows you to mix any resolutions, and it automatically aligns them on the time scale. For example, you can view hourly resolutions with daily resolutions, one-second symbols with 10-tick symbols, or range bars with volume bars.
Behind-the-scenes calculations for multiple data series
This feature allows you to create indicators or strategies that use several data series for its calculations. For example, you could use Bollinger Bands on a one-minute chart, but it will be calculated based on daily data. You only need a few clicks to accomplish this. The program does all of the calculations behind the scenes. It even chooses the correct visualization, such as overlaying data series. MultiCharts .NET gives access to all data from scripts, so you can use for instruments that are not even charted.
Use up to 20 subcharts per chart
You can create up to 20 subcharts per chart, which allows for complete analysis of the big picture. In addition, you can use bid, ask, and trade data, and you can receive data from different providers all in the same chart.
Combine historical and real-time data from different feeds
On top of that, you can combine historical data from one provider and use real-time data from another, in one or more subcharts. This provides the flexibility and choices necessary to meet the needs of your individual trading style. For example, imagine that your data feed does not provide ask and bid history, but does provide quality minute data. In this case, you can combine minute data from your data feed with data from other vendors to get the complete picture.
Add dynamic comments to charts
Expert Commentary lets you add bar-specific dynamic comments to indicators, which then appear when a user clicks on a certain bar. The indicator performs some calculation behind the scenes, and displays text that you define, for example: “Trend is bearish on this bar”, or “Breakout up possible”.
.gif?width=382&height=287&name=multisymbols%20(2).gif)
Innovative object-oriented user interface sets MultiCharts .NET apart from conventional charting software. You get an intuitive, easy-to-use application, which dramatically reduces your learning curve.
User-friendly interface
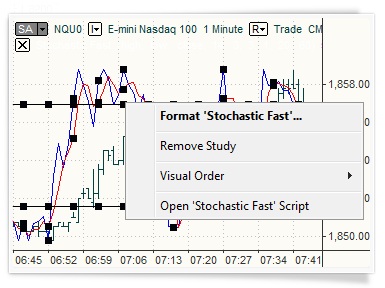
To interact with any object, such as data series, price scales, or chart background, simply click on it. The appropriate menu will appear—giving you only the relevant options. There is no need to spend time going through a complex menu structure; you are only a click away from anything you want to do. To move an object, such as a toolbar or a data series, simply click, hold, and drag. Additionally, you can stretch or compress a scale with a click and drag.
Using .NET to create custom interface and drawings
The extremely flexible .NET framework lets you create objects that cannot be created with PowerLanguage. For example, you create custom toolbars, and draw objects directly on top of charts using GDI.
You can customize the look of MultiCharts .NET from the overall appearance to the tiny details. You have full control to focus on the important data without overcrowding it with excess information.
Adjustable
The colors can be adjusted to quickly pick out important information. Bar spacing can be adjusted for easier viewing. Change the zoom and the margins’ for optimal chart setup. Session breaks, empty periods, indicators, price series, title bars, scroll bars, and divider lines are all easily customized to improve the way you view information.
Dynamic
Changing the visual order of data series, colors, spacing, font labels, divider line styles and more is another great way to pinpoint important information. Chart compression locates the needed data—even among millions of bars. Various dynamic grid styles are supported for added flexibility: point, solid, horizontal, dotted, or detailed dotted grids.
Standard chart resolutions include both time-based and count-based options. Time-based choices include anything from seconds to years. Count-based resolutions are presented by ticks, number of trades, number of contracts traded, price range, and number of changes options.
Resolutions as you like
Custom resolutions, such as 90 ticks, six seconds, seven minutes, five hours, two days, or six weeks can be easily set for any symbol, or a group of symbols. There is also a Change resolution, which constructs a bar based on the number of changes.
No volume loss
Volume bars in MultiCharts .NET are calculated based on the capped principle. This means that the remainder of the volume is transferred to the next bar. For example, if a tick arrives with the volume of 100 and your chart resolution has a volume bar of 75, then 25 will be transferred to the next bar. With this method, no volume is lost.
Hourly bars vs. 60-minute bars
Hourly bars are different from 60-minute bars. Hourly bars use an astronomical clock, but 60-minute bars are bundled together. With the one-hour resolution, the hourly bar would be from 8:30 to 9:00—not from 8:30 to 9:30, as it would look on a 60-minute bar.
Volume bars by tick or actual trade volume
Volume for bars can be calculated based on the number of ticks or the actual trade volume that occurred.
Millions of bars on one chart
In addition, the 32-bit trading platform can easily display 7.5 million bars on one chart for visual analysis and backtesting, which is usually available only in high-end, institutional products. The 64-bit version takes it even further and can display any number of bars, limited only by the amount of memory on your computer.
Our trading platform allows you to set the price scales to match the type of analysis. You may choose between linear or semi-log axes for drastic price movements; two separate vertical scales, one for indicators and one for price movements; or even no vertical axes at all.
Different views, different angles
Each scale can display the data from various angles. For example, a scale can show minimum to maximum values for the entire data range or only for a certain part of the series. Other useful touches include the ability to center the graph on the middle of the scale, set number of digits after decimals, and define the amount of labels present.
Overlay several price series
An important feature of trading software is the ability to overlay several price series with independent price scales. For example, it is possible to chart a financial instrument that costs several hundred dollars over another instrument that trades under a dollar. Then you can visualize the dynamics of price movement.
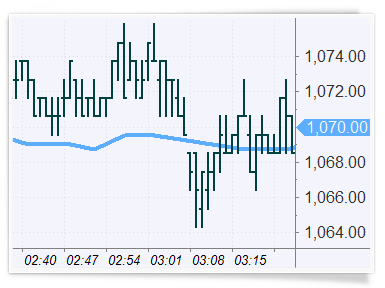
Precision where it counts
For added convenience, the Precise Price marker shows the exact last price and the Countdown feature shows how much time is left until bar close.
When working with charts, the ability to quickly pinpoint the exact price is critical. The Data Window remains on the side of the screen, showing you the current market situation. However, if you need to study a particular area on a chart, the Hint Window conveniently appears at the tip of your cursor.
Your data window
Knowing the exact price at any given point in time is key to trading the markets. The Data Window conveniently stays put on the left side of the screen with all relevant information laid out in an easy-to-read format. It is attached to the main platform window for easy viewing, but it can also be detached and floated like any other chart.
The hint window
If you are analyzing an area on the chart and don’t want to keep looking over at the Data Window, simply click on the chart and the Hint Window appears. It shows you price values, indicator values, and strategy-generated orders for the bar that you’re viewing. Also, the Hint Window can always follow your mouse, or you can make it only appear on demand.
A choice of cursor styles
From various cursor styles (including hand, cross, price tracking mode, and a global cursor that synchronizes many charts) to the floating Hint Window and the stationary Data Window, MultiCharts .NET features a complete package that accurately and quickly tracks price changes and indicator values.
Background dragging
Many traders prefer to ‘grab’ the chart with the mouse cursor and move it around to look for opportunities. The background dragging button on the toolbar turns this mode on and off.
You can display data series using either local or exchange timestamps. Also, in addition to hundreds of existing trading sessions, you can create custom ones to suit trading any instrument and in any time zone.
Timestamps for synchronizing
The choice of different timestamps can be very useful for trading financial instruments worldwide or synchronizing multiple charts to avoid confusion.
View charts any way you like
Several custom trading session templates can be used at the same time for any one symbol, which means that you can get a different angle on your trading. For example, one chart can show pre-trading and regular hours, while another can show you just the regular hours. This can be useful for practicing and learning whether your predictions are correct. The sessions can be changed easily using the Format Instrument dialog window.
Create your own templates
If you want to trade only certain hours of the day or your exotic exchange is not supported by default, you can easily create your own templates. This means you can use MultiCharts .NET in any part of the world, and you can trade any instrument on the worldwide electronic markets.
Professional technical analysis requires that you have professional tools at your disposal. MultiCharts has both regular and exotic chart types to meet your individual needs. Each chart type offers a different perspective on the market—so you can make informed decisions. For technical information on this feature look at the related Wiki page.
A broad range of intelligent drawing tools is available. These tools allow you to focus on trends, support and resistance, gaps, pivots, triangles, and other price patterns.
Trend Lines, Andrews’ Pitchfork, Fibonacci Arcs, Gann Fans, and other studies can be easily drawn with a mouse click. For technical information on this feature look at the related Wiki page.
Scan all symbols universe one-by-one with a specified frequency and at the same time monitor hundreds of selected instruments in real-time. Now thousands of instruments can be automatically sorted out from the whole market according to your indicator criteria for further updating in real-time. Multi-core support and 64-bit architecture make the Market Scanner the most powerful tool for finding trading opportunities.For technical information on this feature look at the related Wiki page.
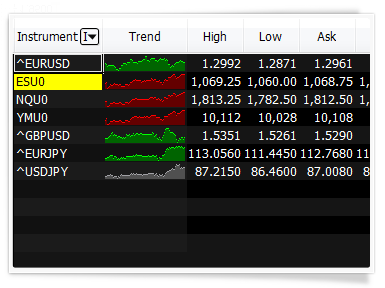
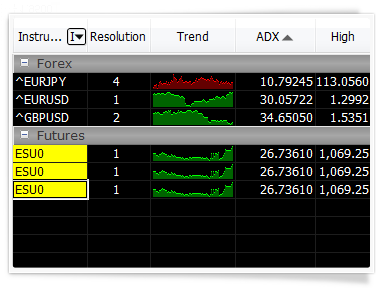
Market Scanner is a watchboard for monitoring symbols you are interested in and finding opportunities. The new version of our Scanner has two components: Pre-Scanning and Watchlist windows. While a single chart gives you details about one symbol, the Scanner allows you to spot opportunities among thousands of symbols.
Monitoring and tracking your opportunities
For example, you want to find all symbols that have oversold recently. The logic is that these instruments will be below their normal value and they present a potentially profitable opportunity. To do this, simply add symbols that interest you into Pre-scanning list, insert a pre-built or custom indicator, and specify the threshold value.Those symbols that satisfy the conditions will be shown in Watchlist window for updating in real-time.
How does Pre-Scanning work?
When instruments are added into Pre-Scanning list and your criteria are set, scanning can be started. To start scanning click the Rescan now button which initiates both historical and real-time snapshot data requests. The data is requested in parts, depending on the limitation of the data source – this lets Market Scanner get data for many instruments without breaking the limitations set by data sources. When all requested data is received, instruments will be unsubscribed from the data source and data will be requested for the next set of instruments.
How does Watchlist work?
The instruments in Pre-Scanning are evaluated as per the scanning criteria, and ones that satisfy the parameters you set are automatically copied into the Watchlist window. You can select either the best or the worst scanning results to be displayed in the Watchlist for updating in real-time.
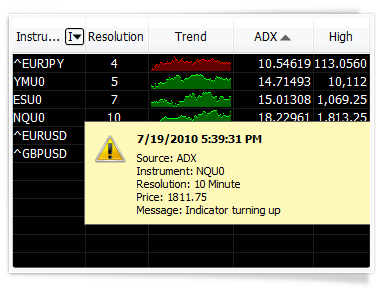
You can use different resolutions in different rows. For example, you could have the same symbol in tick, minute and day resolutions to monitor different trends. For even more flexibility each row can have its own session template and a unique number of bars a study will reference.
20+ important data fields
Open, High, Low, Close, Total Volume, Bid, Ask, Open Interest and other important data fields can be removed and added in seconds.
.png?width=385&height=288&name=7016_Market_S_2%20(1).png)
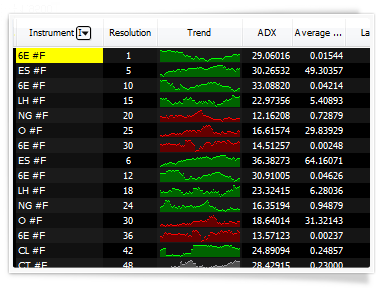
In addition to symbol linking, which allows you to change chart contents with a single click, MultiCharts .NET has a unique feature called Market Trend Histogram. This allows you to see market dynamics without building a chart, but if you can still make a full-sized chart with one click if needed.

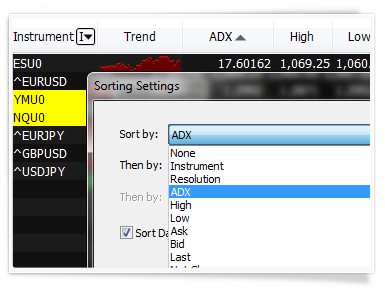
Scanner can automatically re-sort symbols either on a per-second basis or by a user-defined timer. Since you can sort according to any criteria available, this will help find trading opportunities in a timely fashion.
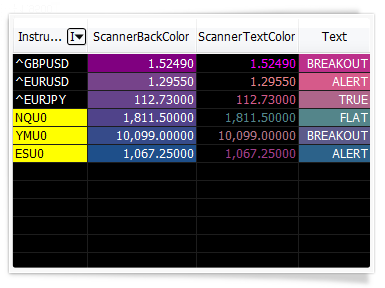
In addition to hundreds of studies that come with the trading platform, you can create your own, change existing ones and import from a variety of sources. Scanner’s distinctive feature is that you can change cell background and text coloring based on your personal criteria, and even have script-driven text generation in the Scanner cells.
You can create custom visual, sound, and email alert for one or all symbols. Scanner alerts work the same as they do on regular charts.
You can visually group symbols according to any criteria. An important distinction of having a group is that sorting is realized within each individual group. This means you can select important sectors of the industry, or interesting stock groups, and see which one tops the others. Groups can also be minimized and restored at will.
Monitor thousands of real-time or end-of-day symbols in each Scanner window. You can even mix instruments with different resolutions and from different data feeds.
Built to minimize your computer’s efforts
Since our Real-Time Market Scanner was built to use modern multi-threading architecture, it can use multi-core and multi-CPU computers to their full potential. This allows you to create very CPU-intensive workspaces with thousands of instruments and watch them in real-time without gaps or lags.
64-bit version removes all memory limitations
The 64-bit version of MultiCharts .NET can take advantage of powerful computers to the fullest extent by using all available memory. This means you can add a lot more than 5,000 symbols per scanner window, making it a much more powerful tool.
Your indicators and strategies can access data for symbols that are not even charted, giving you maximum flexibility when making trading decisions.