hfflogo


Hidden Force Flux Trading Platform Key Features

Hidden Force Flux is powered by our institutional-grade proprietary algorithm.
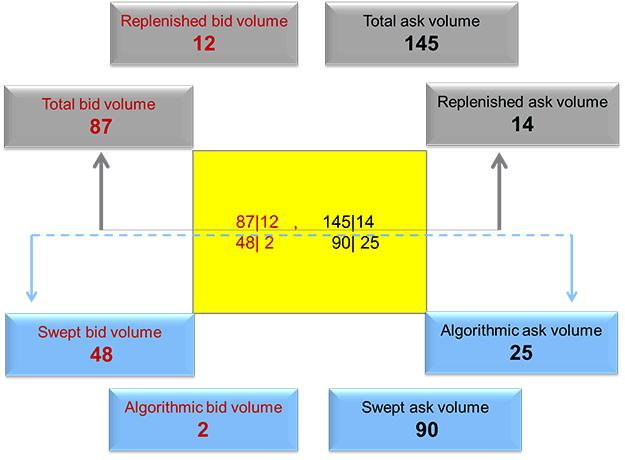
Sign Up Today

Hidden Force Flux Key Features


Our platform is:

  • 1. Easy to use
  • 2. Provides quick visual to quick action (volume at price box turns yellow when algorithmic volume occurs)
  • 3. No unnecessary charts and graphics to distract and provide false sense of “security”
Hidden Force Flux chart format
  • ‘total|replenished’ bid volume displayed in the left half of the volume at price box
  • ‘swept|algorithmic’ bid volume displayed underneath ‘total|replenished’ in the left half of the volume box
  • ‘total|replenished’ ask volume displayed in the right half of the volume box
  • ‘swept|algorithmic’ ask volume displayed underneath ‘total|replenished’ in the right half of the volume box

Example_Yellow-Box

 
Volume types explained (applies equally to bid/ask volume):
  • ‘total’: bid/ask volume traded during that time period
  • ‘replenished’: volume traded in excess of the displayed best size
  • ‘swept’: volume traded while order book level(s) is(are) being swept-’fast move’ volume
  • ‘algorithmic’: volume determined by our proprietary computation
 
The various types of volume expose to various degree some of market’s intentions.

Replenished:

  • excellent at early detection/spotting of iceberg orders
  • signifies increased orderflow support/resistance in areas where it is high at bid/ask, helpful in identifying/confirming potential reversal/continuation areas

Swept:

  • occurs in areas where stops might have been run or breakout orders have been triggered
  • depending on the size of this volume one can get a better gauge of whether a breakout will fail/hold

Algorithmic:

  • full order book data along with time/sales are used in our proprietary computation to determine this volume
  • excellent at high precision detection of reversal/continuation points in the market
  • unique in that even a very small algorithmic volume size (be it just 1 contract) is capable of the same precision in pinpointing the potential reversal/continuation points in the market
CumulativeBidAskDelta chart format
  • displays price graph (blue line) along with cumulative delta graph (black line)
  • shows red/green dots/diamonds where ‘localized delta divergence’ occurred
  • shows red/green solid/dashed lines at the level where ‘orderflow support/resistance’ was detected

CumulativeDelta22

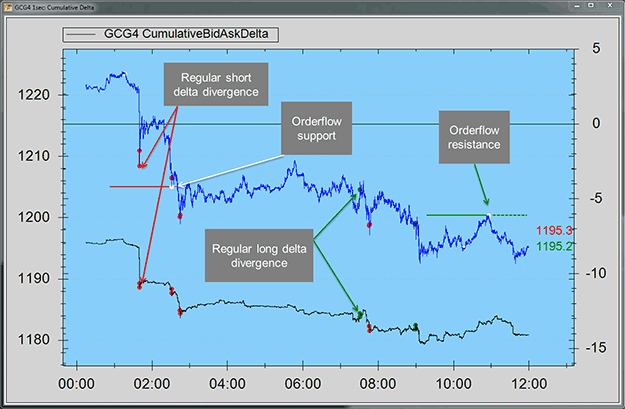
The concepts of ‘localized delta divergence’, ‘orderflow support/resistance’ are explained in Owner’s Manual which becomes available when you download and install the software.
Note: just to further clarify our concept of ‘localized delta divergence’ is different from the usual delta divergence you may be familiar with and is based on our proprietary computation.

Localized delta divergences and orderflow support/resistance can be used to:
  • spot areas where increased trade density resulted in ‘one sided’ order flow pressure that either failed/prevailed in subsequent price action
  • determine significant reference points for future price action when price revisits these areas
  • gauge ‘strength’ behind a move

We will beat or match any commissions quote!
Or get 20 Commission-FREE trades!


GET YOUR Ultra-Cheap Commissions >>

Most Recent Blog Posts

Presidents' Day Holiday Trading Schedule (2024)

From the CME Globex Control Center, here is the summary of KEY changes, per CME market segment Monday, February 19,...

CME Exchange Fee Increase (Effective February 1, 2024)

Effective February 1, 2024, Chicago Mercantile Exchange Inc. (“CME”), The Board of Trade of the City of Chicago, Inc....

Martin Luther King Day Holiday Trading Schedule - 2024

From the CME Globex Control Center, here is the summary of KEY changes per CME market segment Monday, January 15, 2024...