Good Friday Holiday Trading Schedule (2024)
From the CME Globex Control Center, here is the summary of KEY changes, per CME market segment Thursday March 28, 2024...
MotiveWave® is an incredibly feature-rich platform using Windows & Mac OS X.
MotiveWave Software is a well-established developer of easy-to-use full-featured charting, analysis, and trading software built for the individual trader. Our product "MotiveWave" has very advanced charting and drawing tools that are highly customizable and yet still easy-to-use, and also specializes in advanced analysis tools like Elliott Wave, Fibonacci, Gartley, Gann and Ratio Analysis. Plus, MotiveWave has all of the features (and more) that you would expect in a professional standalone trading platform, including scanners, strategy trading, custom strategies, backtesting, optimization (genetic and exhaustive), replay mode, walk-forward testing, reporting, and trade simulation.
Use the console to organize your charts, watch lists and other utilities all within one window. The console comes with a default set of pages and layouts. Customize it to meet your specific needs.
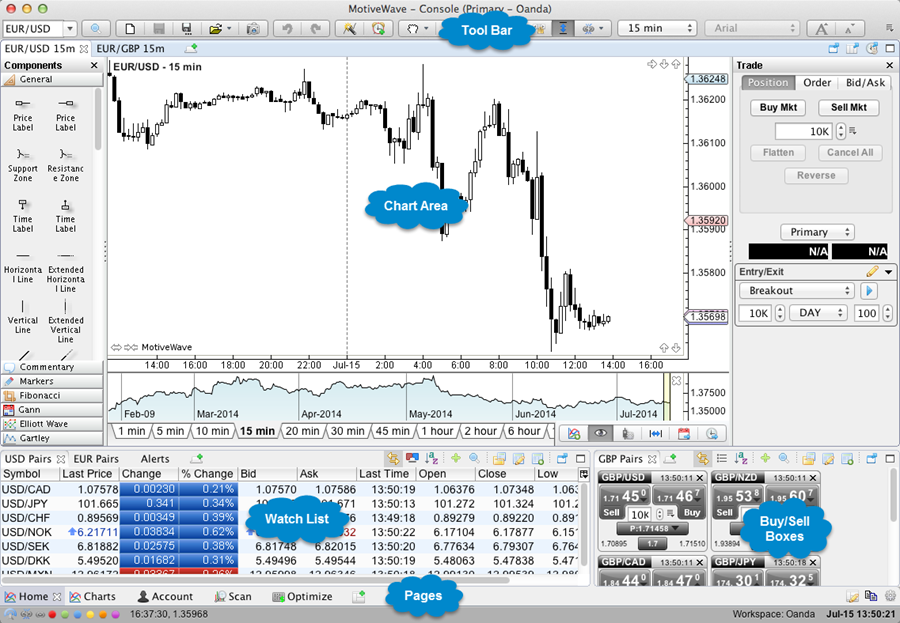
Pages allow you to organize and manage different layouts all within a single window. Use the Page Bar at the bottom of the Console window to switch between layouts. Several pages are created as part of the default layout. You may add, remove or modify these pages to customize to your unique preferences.

For your convenience, MotiveWave provides several built-in page layouts for you to choose from. Click on the Edit Page button to select a different layout from several different categories.
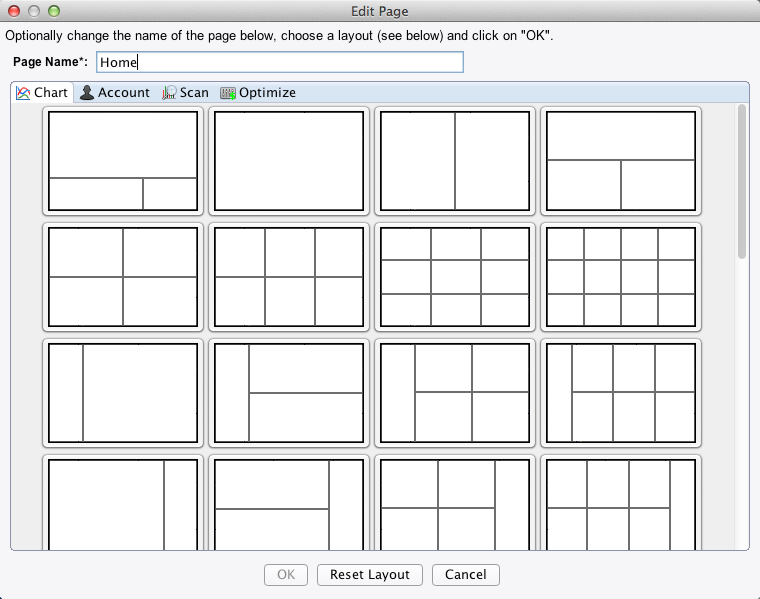
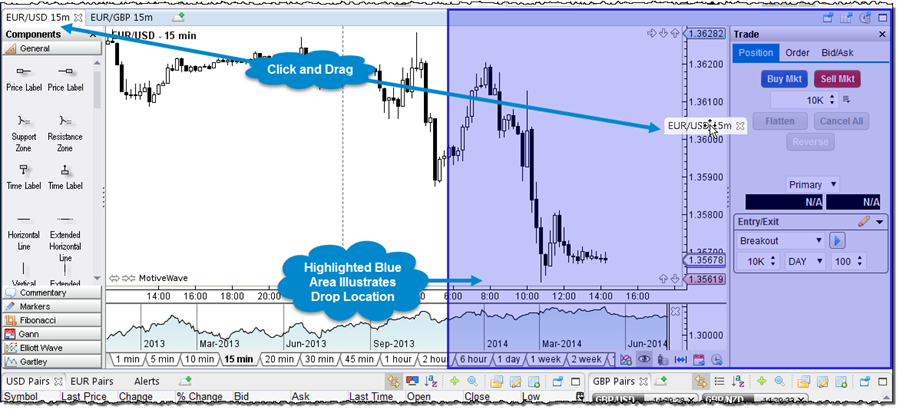 Alternatively, click and drag the tabs in the page to arrange it however you like.
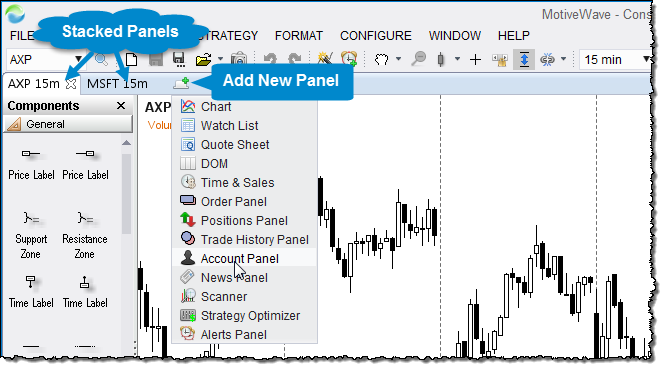
Panels may be “stacked” on top of each other. Clicking on a tab will activate a panel. Additional panels may be created by clicking on the “Add Tab” button to the right of the panel tabs.
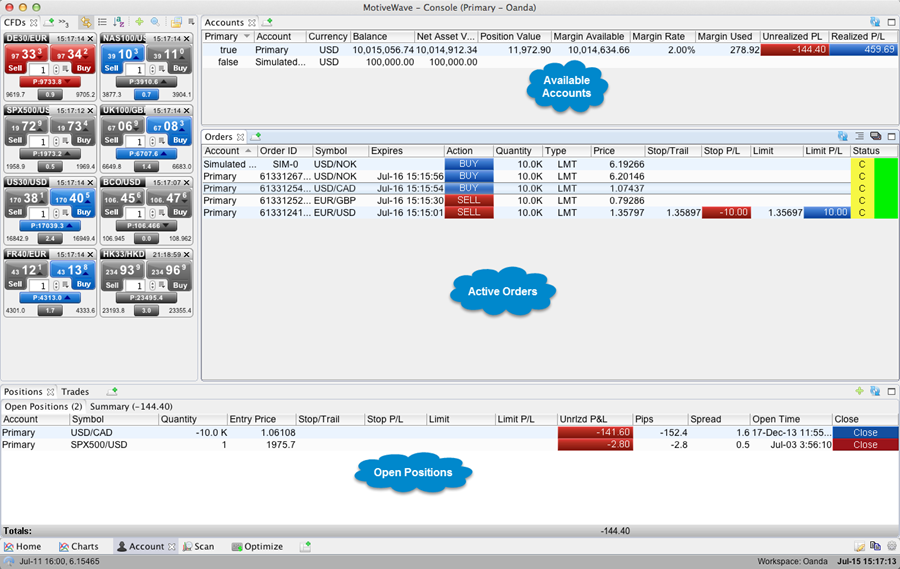
With integrated trading, MotiveWave makes it easy to place and adjust orders. Manage all of your orders directly from the console.
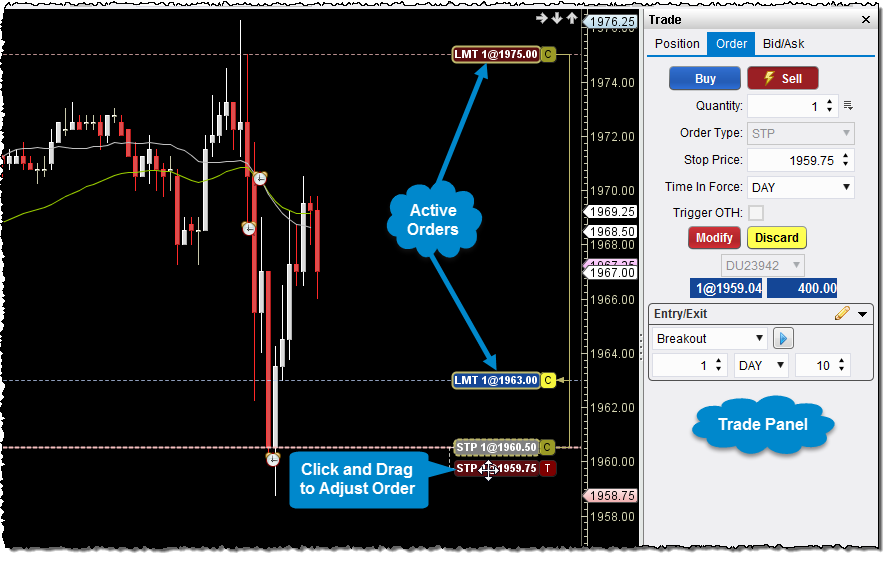
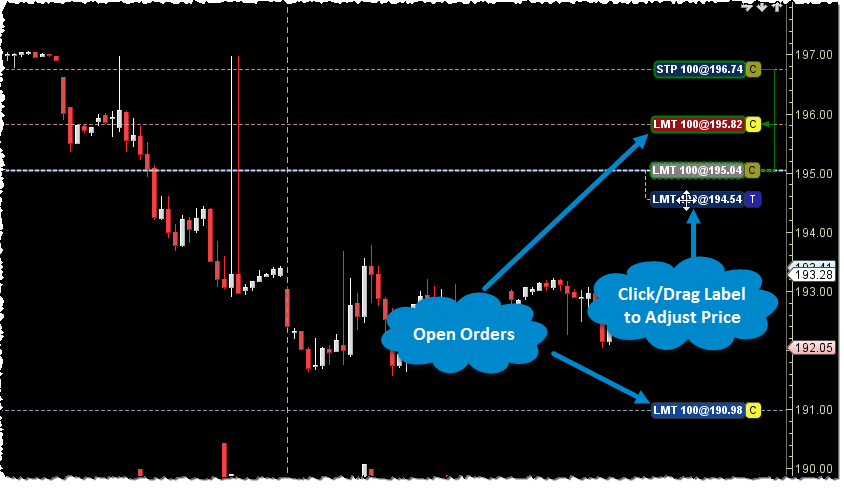
Conveniently manage and adjust your orders directly from any chart.
Use custom instruments in MotiveWave to combine the historical and real-time prices of 2 or more instruments to create:
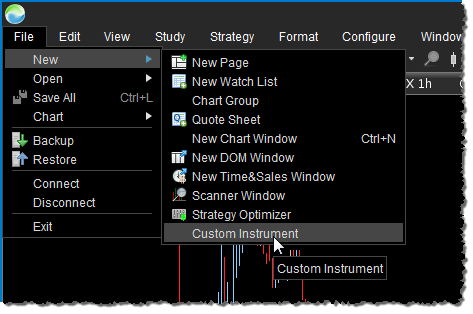
The example below illustrates the creation of US Dollar Index using a custom instrument. Start by choosing File -> New -> Custom Instrument from the Console menu bar.
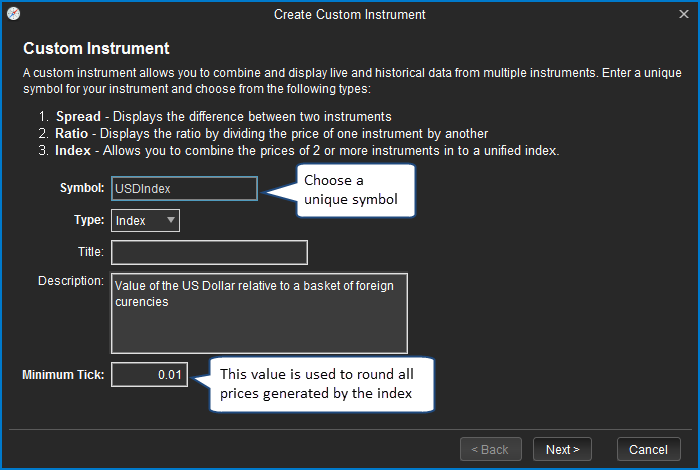
This will open the Custom Instrument Wizard. On the first page of the wizard, choose a symbol for the instrument (must be unique) and select Index as the type. Optionally enter a title and description. The Minimum Tick field is used to round the prices that are generated by the index (default is 0.01).
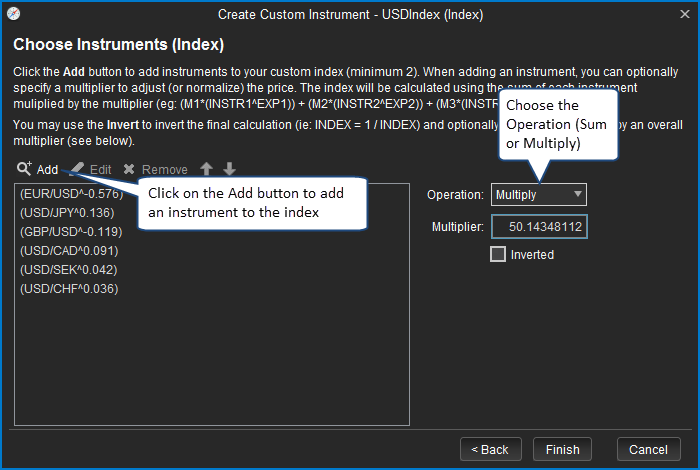
The next page of the wizard is used to define the formula for creating the index. In the case of the US Dollar Index, the formula is as follows:
USDIndex = 50.14348112 x EUR/USD^(-0.576) x USD/JPY^(0.136) x GBP/USD^(-0.119) x USD/CAD^(0.042) x USD/CHF^(0.036)
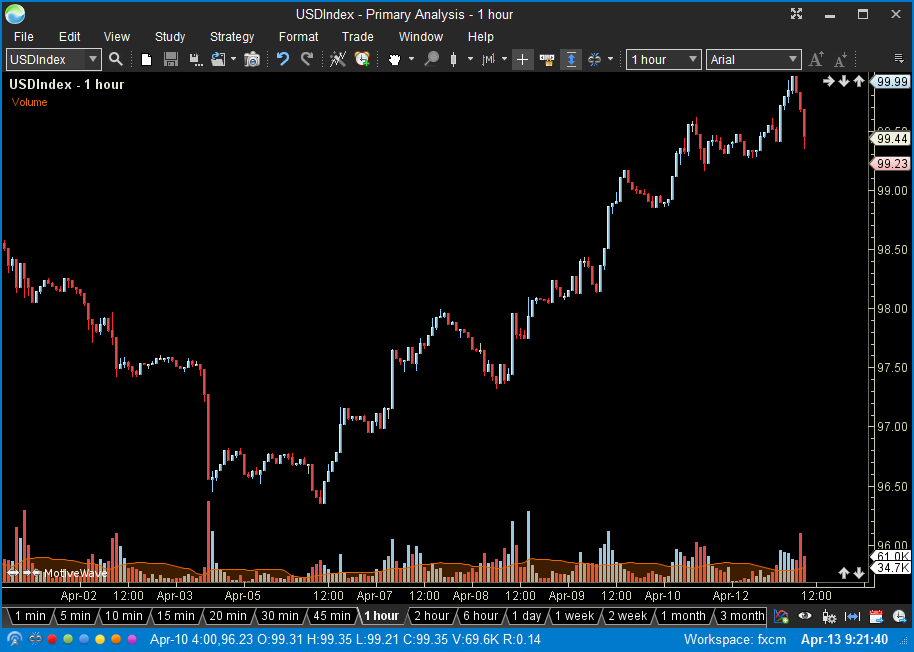
The chart below shows the USDIndex on a 1 hour chart. The chart will be updated in real-time using the tick data generated by the instruments that make up the index.
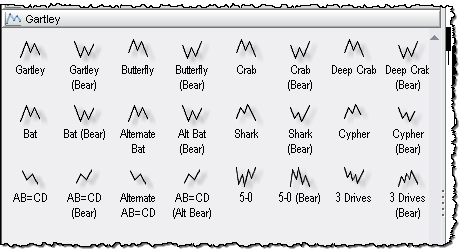
MotiveWave has a very advanced set of Gartley tools that come in manual, semi-automatic and automatic Gartley to suit your preference. There are 24 manual Gartley components (bull and bear) that you can add to the charts, including Gartley pattern, Butterfly, Crab, Bat and more. Shaded areas and ratio label guides allow you to easily place points on the chart to wire up the patterns correctly. Our Auto Gartley tools allow you to select an area of a chart to search for either a Gartley or ABCD pattern. The Gartley Scanner (pattern recognition tool) allows you to search for specific Gartley Patterns across multiple symbols/instruments based on options you choose. All Gartley patterns can be moved or adjusted after being placed on the chart.
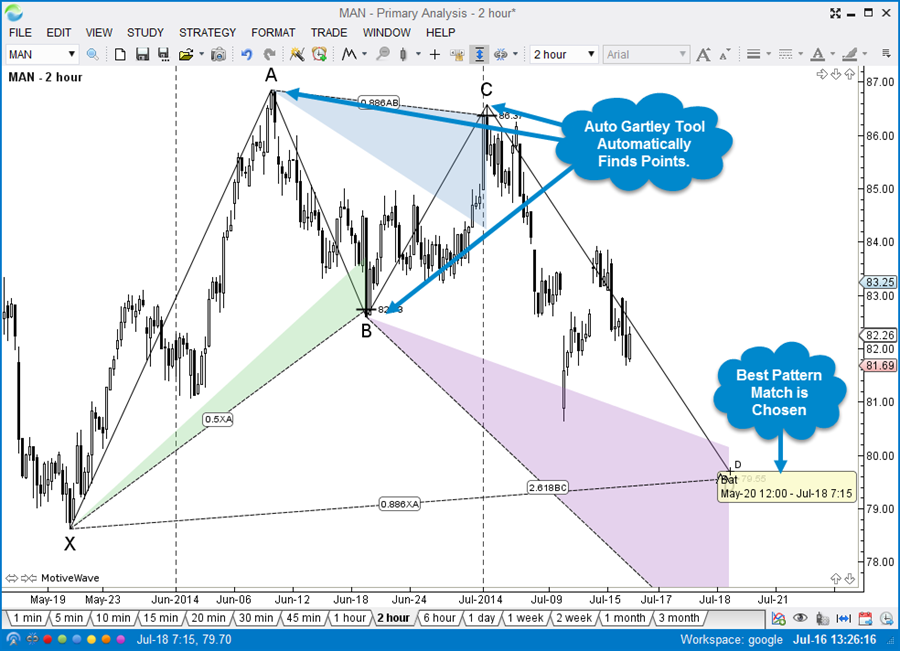
Auto Gartley Tool
Use the Auto Gartley Tool to automatically choose points and assign the most appropriate XABCD Pattern.
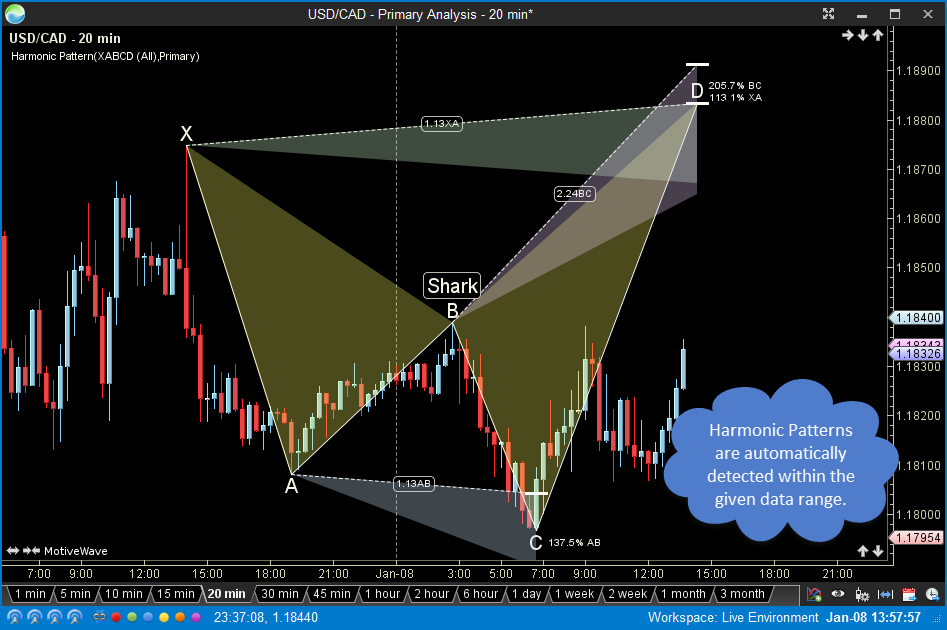
Harmonic Pattern Study
Use the Harmonic Pattern Study (Study -> Overlay -> Harmonic Pattern) to automatically detect and display the best fitting pattern for the given data range.
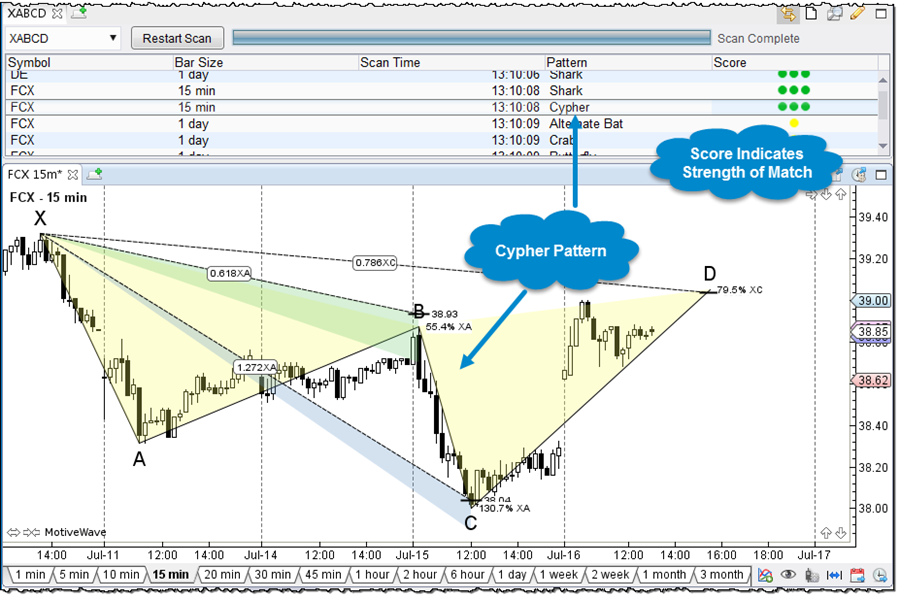
Scanner
Scan for your favourite Harmonic trading opportunities using our Scanner feature.
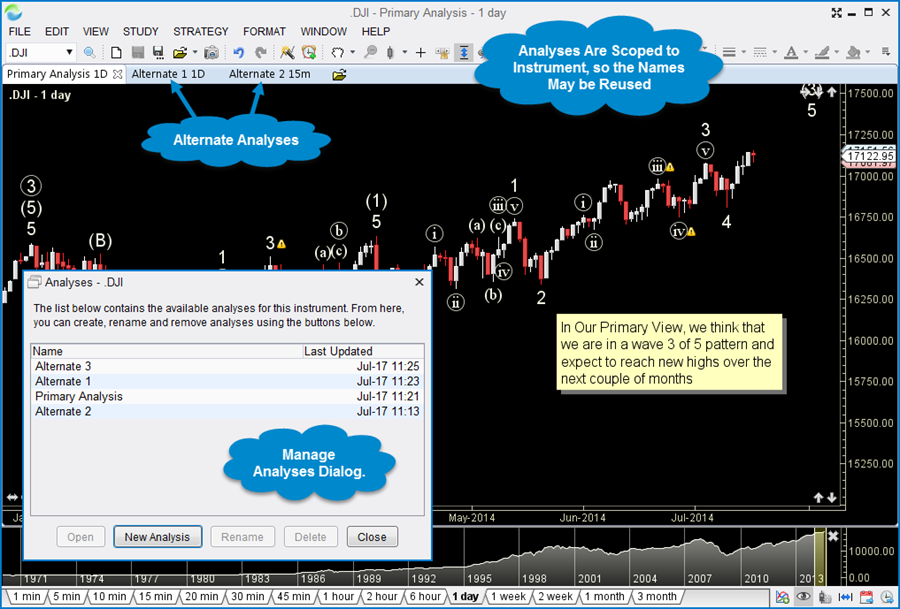
MotiveWave has a unique concept of creating an alternate analysis. It is normally used with Elliott Wave analysis for exploring alternate outcomes, but can be used for any advanced technical analysis. Charts in MotiveWave can be saved so you don’t lose your analysis. An alternate analysis lets you look at a possible diverging outcome in a separate chart so you don’t have two analyses competing or looking too busy on a chart. You can choose to start your Alternate Analysis based on an existing chart and make appropriate changes to the new chart or you can start an Alternate Analysis from a clean blank chart. Either way, your original analysis is saved and will not be changed.
With over 275 built-in studies, you are sure to find what you are looking for. MotiveWave has a lot of advanced study features to provide you with the flexibility that you need.
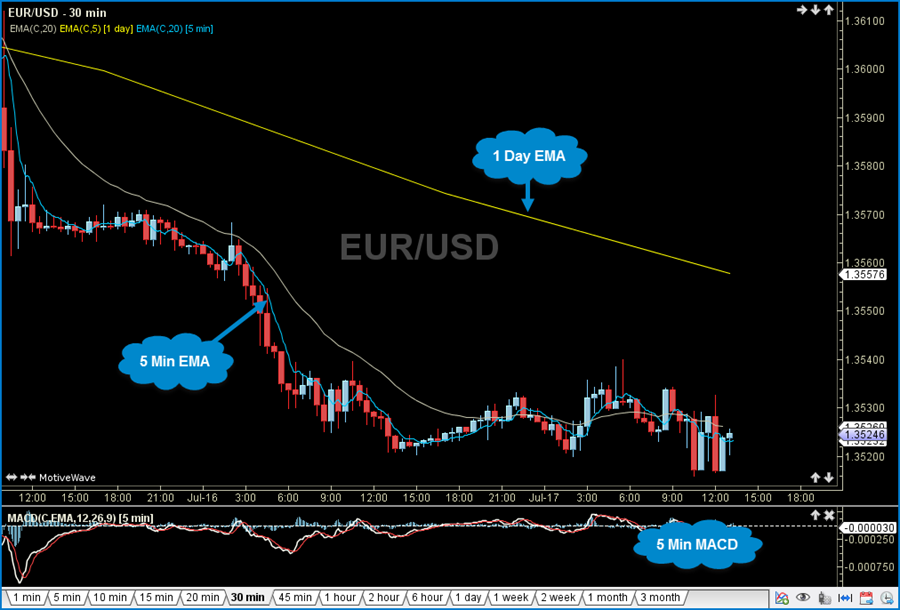
Multiple Time Frames
Studies of different bar sizes may be displayed on the same chart. For example, you can overlay a 1 day moving average on a 15 minute chart or display a 5 minute RSI on a 1 hour chart.
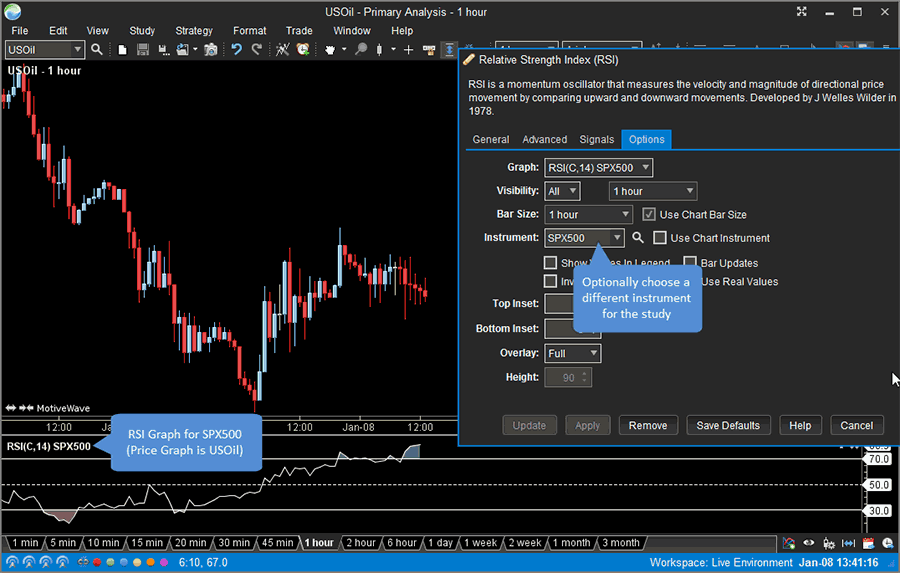
Study Instrument
Optionally you can choose a different instrument for a study graph. In the example below, the RSI is based of the SPX500 symbol on a USOil chart.
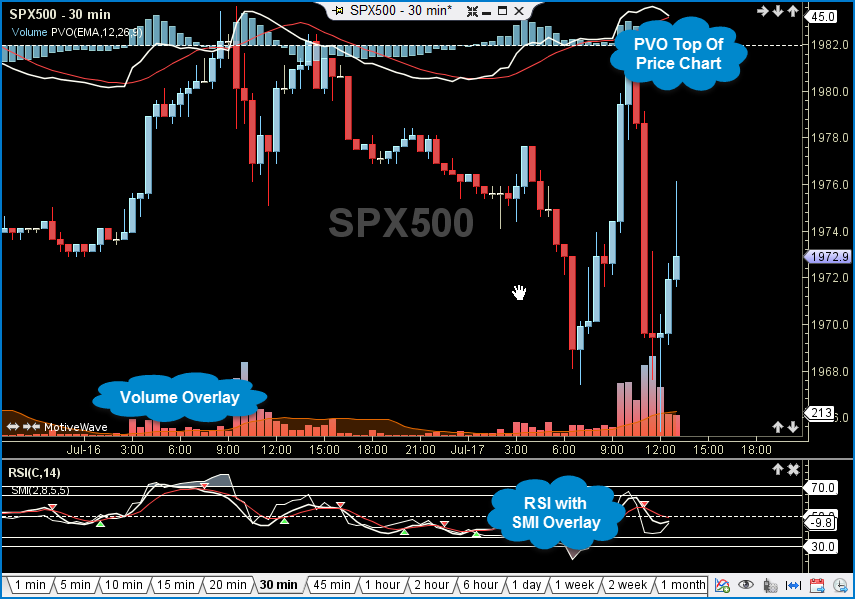
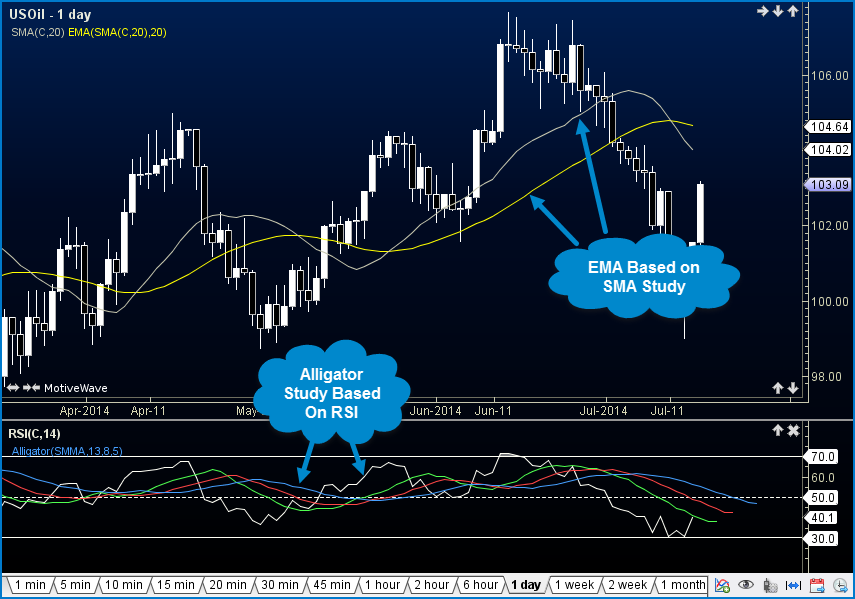
Overlay Plots
Study Plots may be overlaid on other plots (such as the Price Plot).
Study Inputs
Studies can be based on inputs from other studies. For example an EMA can be based on values from another EMA, or a signal (moving average) can be added to an existing plot such as RSI.
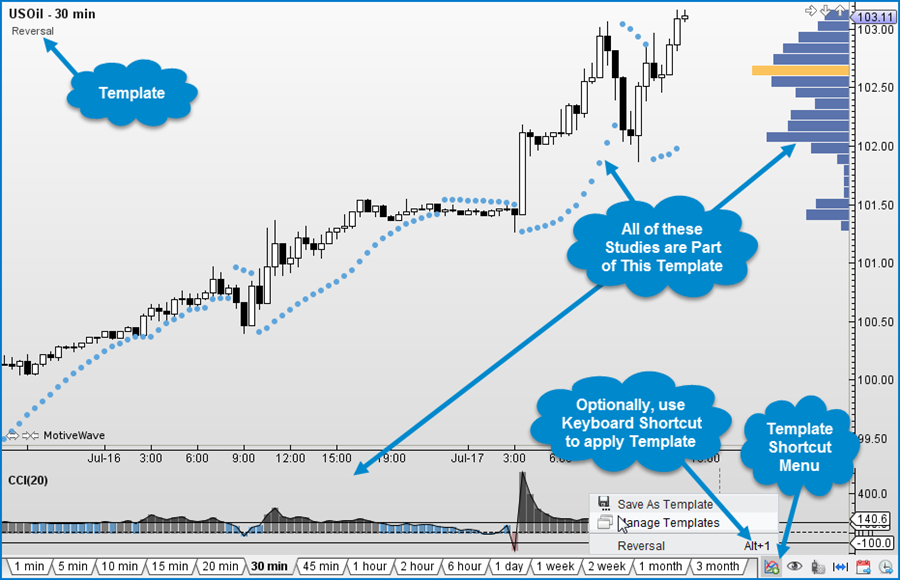
Templates
Study Templates are a convenient way to group sets of studies together and apply them to a chart with ease. A default template can be configured for use with all charts.
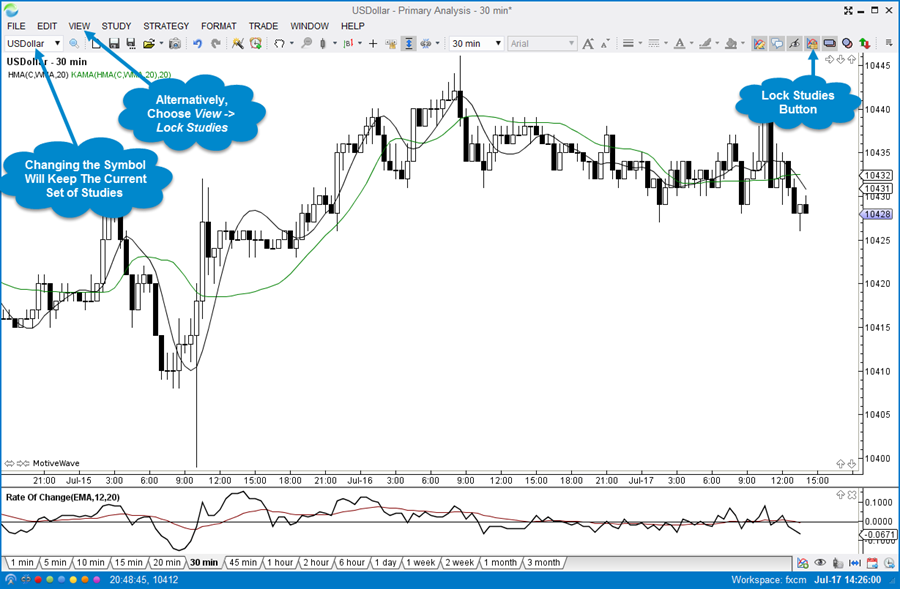
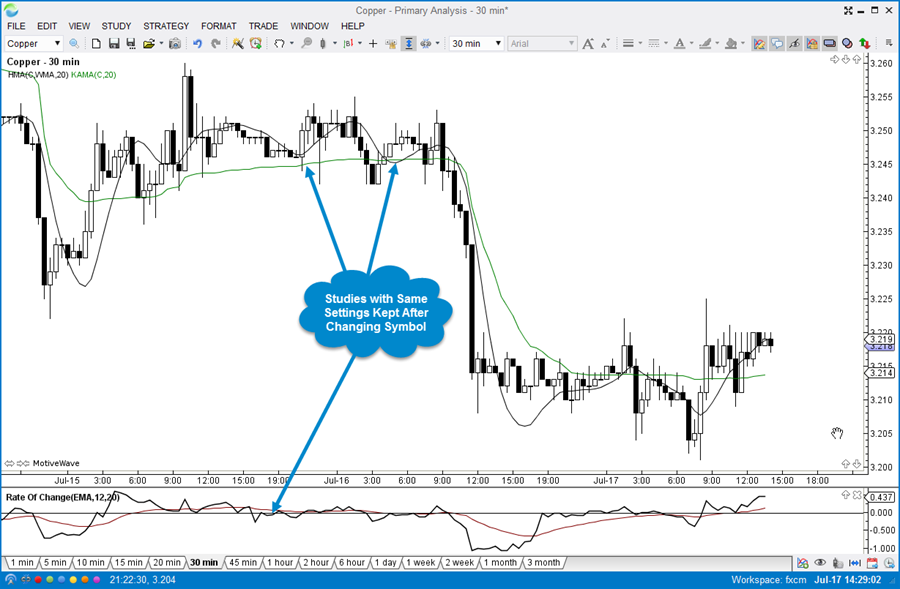
Lock Studies
The Lock studies feature permits you to make the current set of studies stick to the chart. Changing the symbol will ensure that the existing studies are applyed to the new symbol.
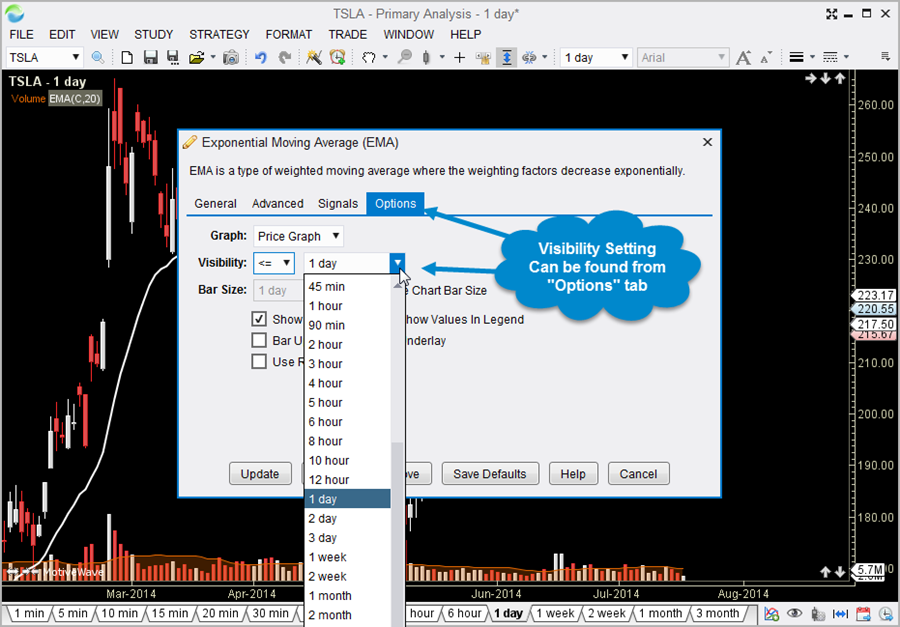
Visibility
For convenience, studies may be assigned a visibility attribute that makes them visible on only specific bar sizes. This allows you to automatically show or hide them when changing the bar size.
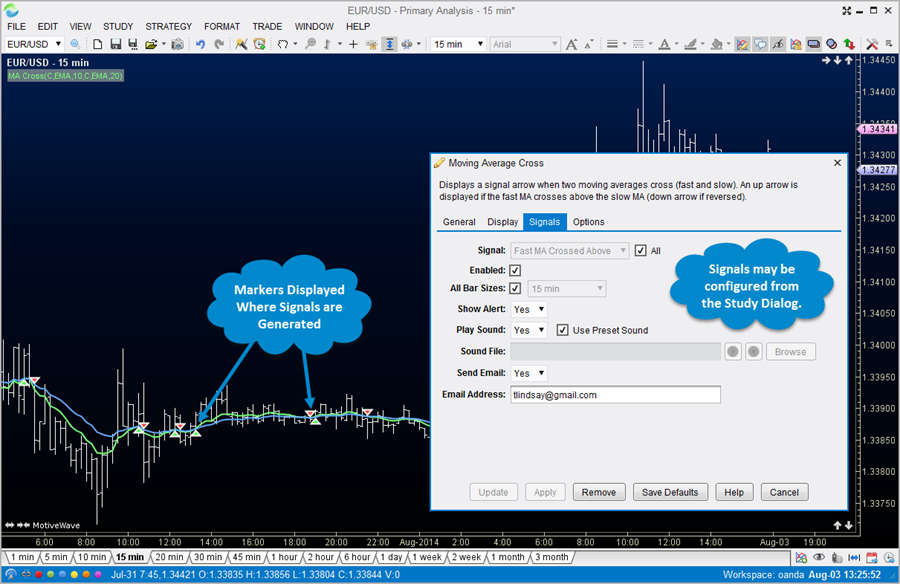
Signals & Markers
Many of our built-in studies generate signals when events of interest occur. These signals can be used to popup messages, send notifications to your smart phone or build custom strategies.
Strategies may be used to fully or partially automate your trading. MotiveWave comes with over 30 strategies out of the box and you can create your own strategies using our Java SDK. Source code for our existing strategies can be made available upon request.
Fully Automated
MotiveWave comes with several fully automated strategies. Choose your strategy and click on the Activate button to begin trading.
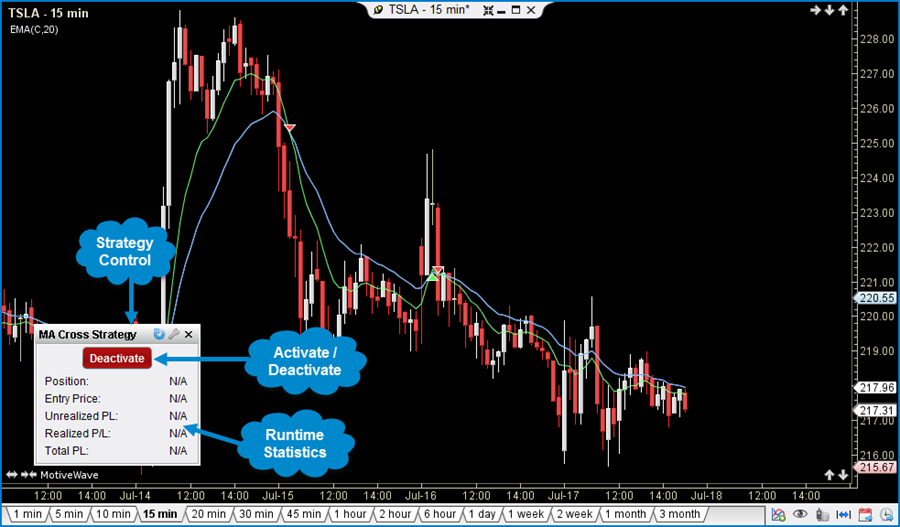
Partially Automated
Sometimes you want to have some level of control over how the strategy performs. Partially automated strategies allow for this level of flexibility. Optionally choose when to enter a position and when to close and exit the strategy.
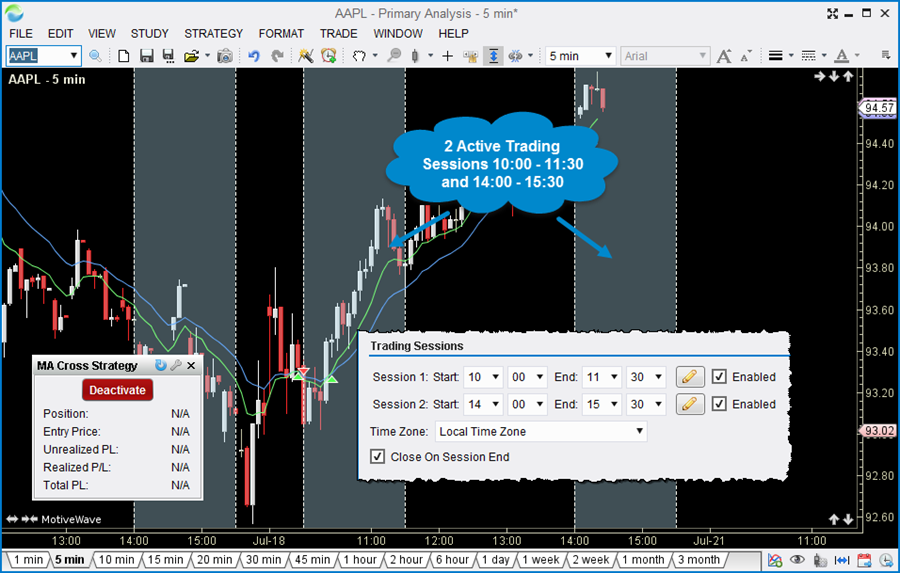
Trading Sessions
Trading sessions allow you to define times of the day when you would like to run your strategy. MotiveWave allows you to define one or more trading sessions and the behavior of the strategy when these sessions begin and end.
Replay Mode
Testing or learning how to effectively use a strategy can be costly and time consuming when working with live data. Use the replay mode to go back in time and run your strategies using historical tick data.
Use Replay Mode to validate a market theory, test an automated strategy or to practice your Elliott Wave counts. MotiveWave’s advanced Replay Mode provides the flexibility and functionality you need to simulate a trading environment using historical data.
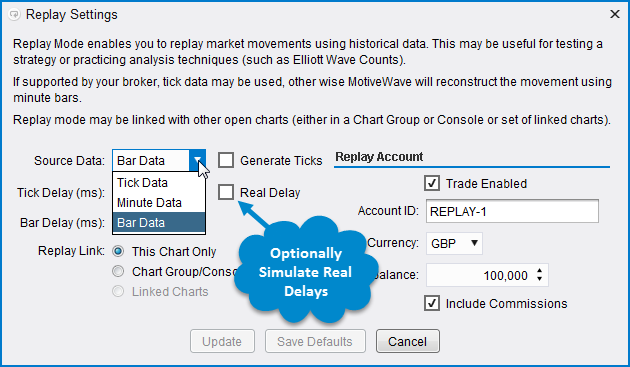
Historical Data Options
MotiveWave provides several options for replaying historical data:
Real Delays – Optionally, you can tell MotiveWave that you want to use real delays between ticks to precisely simulate what a real trading environment would be like.
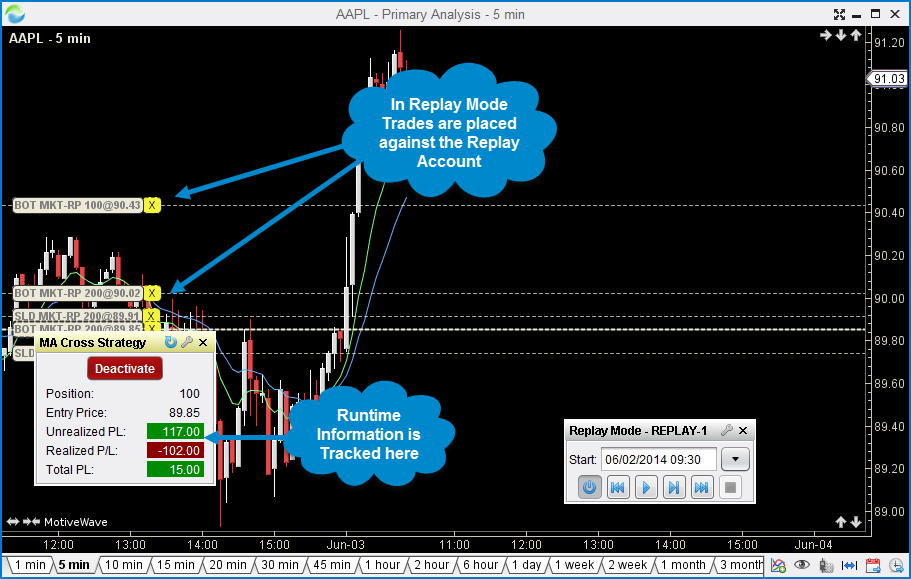
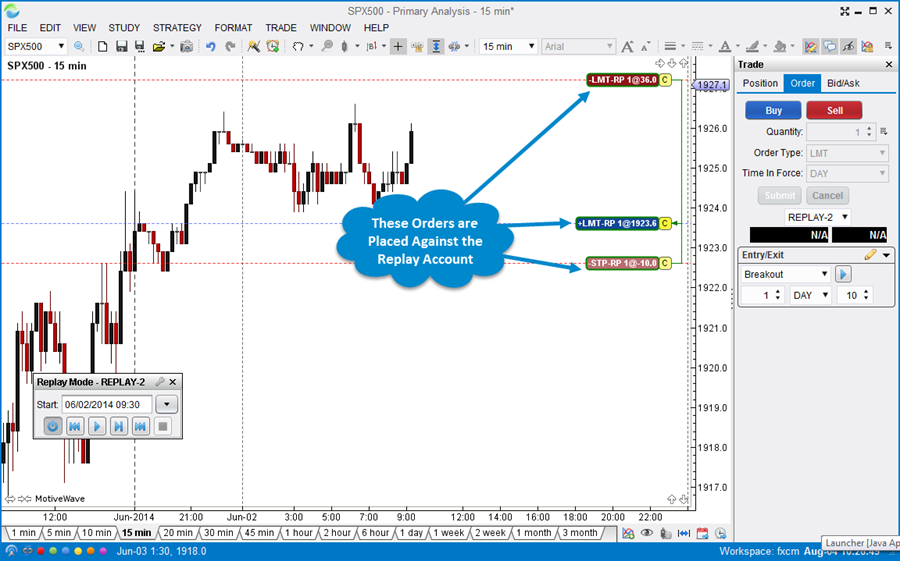
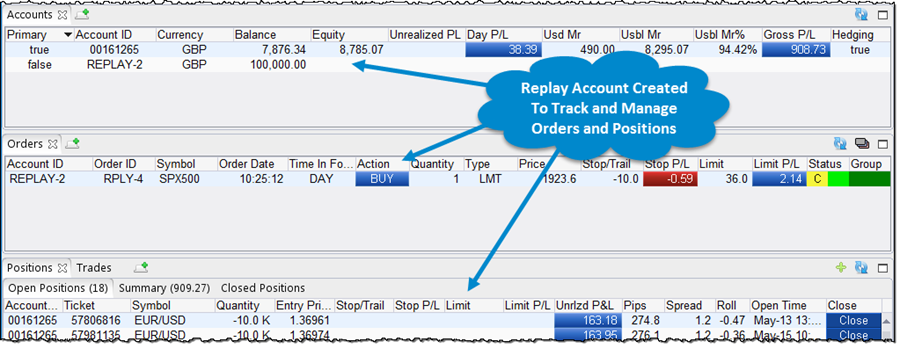
Place Trades In Replay Mode
When Replay Mode is initiated, a special replay account is created to manage and track the trades that you create. Each replay session is assigned its own replay account so you can run multiple replay sessions at the same time.
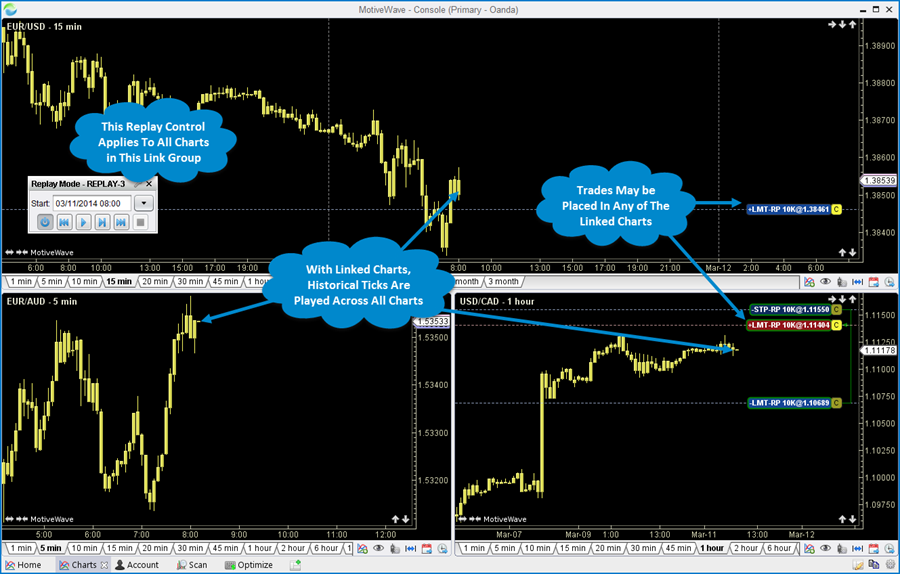
Linked Charts
Several charts may be linked together in one replay session. When using the Replay Control to step forward, respective ticks are played across all charts in the linked group.
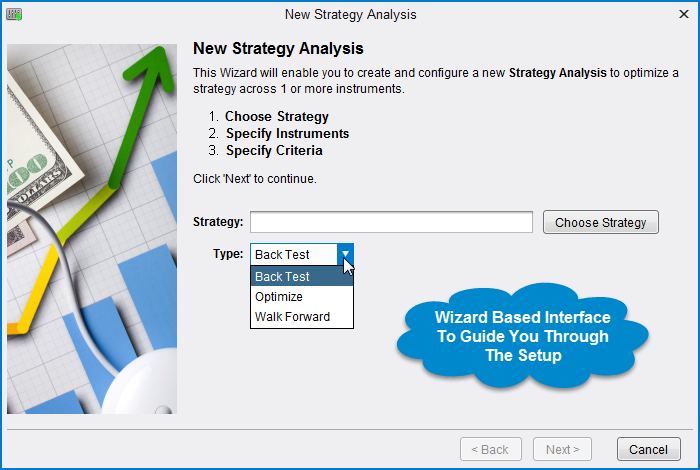
MotiveWave provides powerful tools to enable you to test and optimize your strategies using historical data. Use our wizard-based interface to guide you through the process. Testing may be performed using actual tick data provided by your data service. If this data is not available, MotiveWave can generate ticks using historical bars and even minute-based bars.
Backtesting
Backtesting enables you to see how your strategy would have performed over a given time period in the past. MotiveWave allows you to use any bar size and test over any number of instruments.
Optimization
The profitability of a strategy will vary depending on how it is configured. This option will enable you to specify a range of settings for the strategy and test many different combinations of these settings to determine which combination is “optimal”.
Exhaustive
Exhaustive testing will test every combination of settings within your customized parameters and ensure that the optimal settings for your strategy will be found.
Genetic Optimization
Sometimes the number of possible combinations for your strategy settings is too large and exhaustive testing is impractical. Genetic Optimization utilizes a genetic algorithm to reduce the number of combinations that are included in the optimization process. This adaptive approach mimicks nature’s evolution where the combinations that are most profitable rise to the top.
Walk Forward Testing
Sometimes knowing the optimal settings for a specific range of data is not enough. Just because a strategy performed well for a specific bar size and time frame does not guarantee that it will continue to perform well in the future. Walk forward testing helps to mitigate this problem by stepping foward in time after every iteration of a time frame.
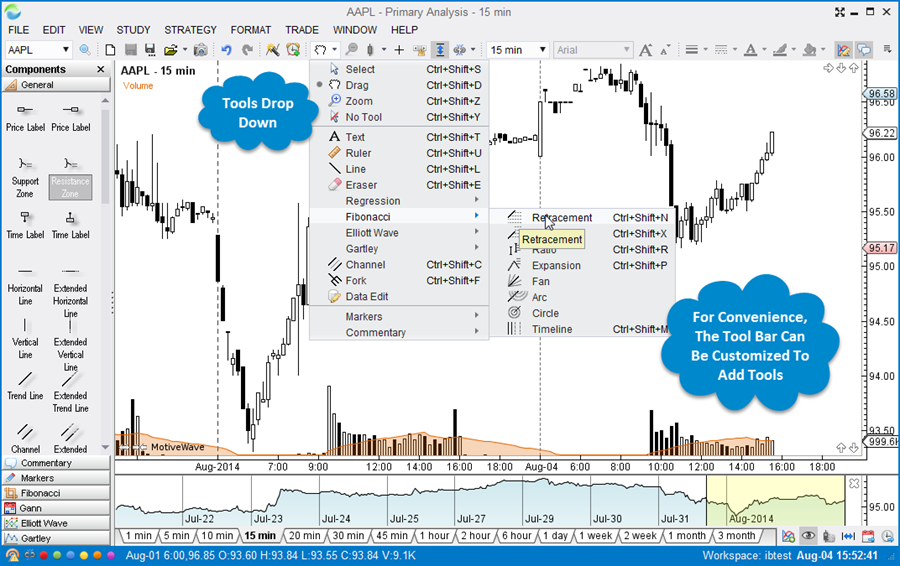
MotiveWave comes with over 180 specialized drawing components and dozens of drawing tools. Open the Components Panel for easy access. Simply click and drag components onto a chart to add them to your analysis.
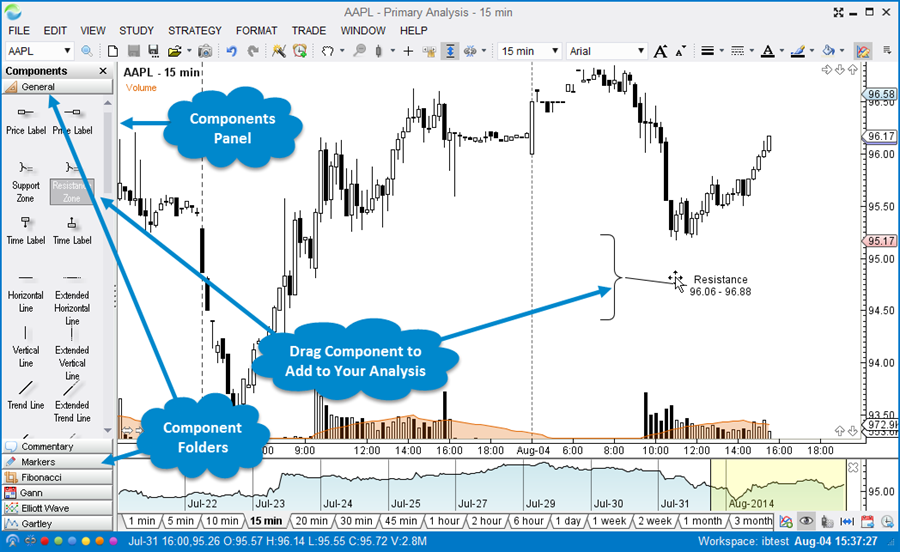
Use the tools dropdown to select a drawing tool. For convenience, the tool bar may be customized to add frequently used tools.
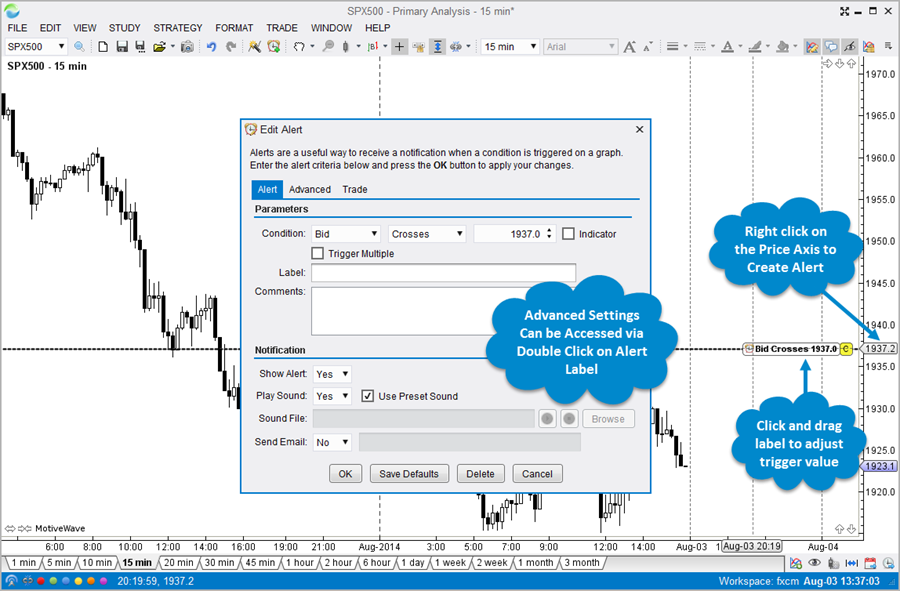
Alerts are an essential tool for traders who trade multiple instruments or who want to be notified when a particular event has occurred. MotiveWave includes some highly advanced alert functionality suitable for all levels of traders.
Price Alerts
Use Price Alerts to be notified when a particular price for an instrument has been reached or exceeded.
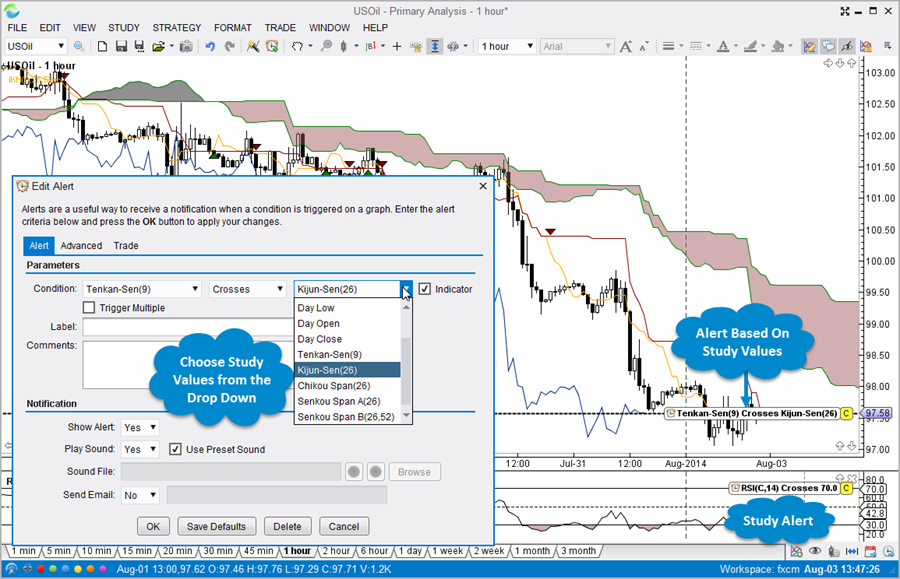
Study-Based Alerts
Alerts can be created using values that are generated by studies added to a chart.
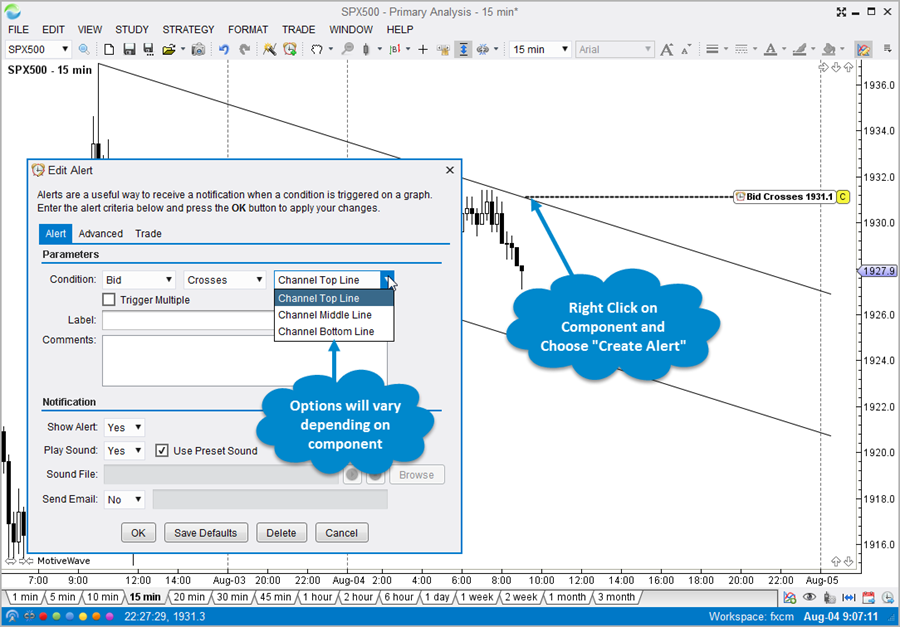
Component-Based Alerts
Components such as Trend Lines, Channels and Forks may be used to generate alerts. Simply right click on the component and choose Create Alert.
Notifications Sent to Your Smart Phone
Alerts may be configured to play custom sounds, display popup messages or to send an email to your smartphone.
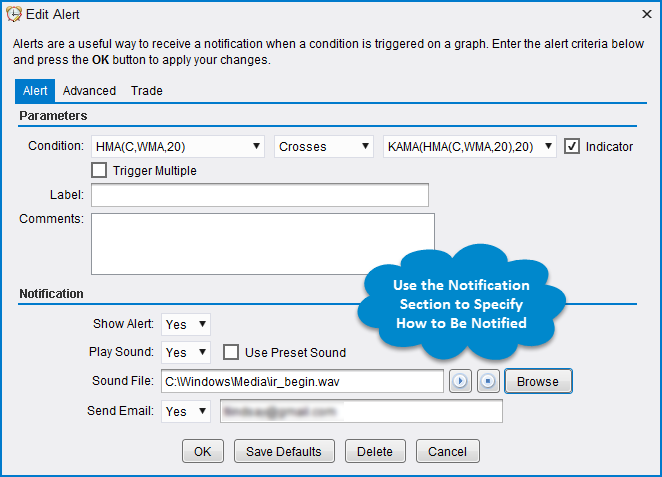
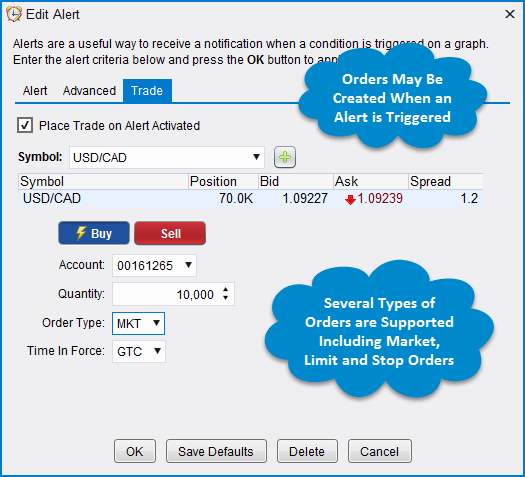
Place Trades From Alerts
Orders may be created when alert is triggered. Automatically create market, limit or stop orders
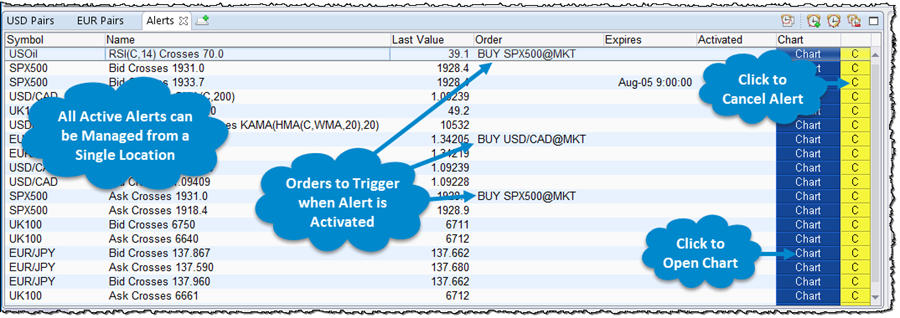
Centralized Alert Management
Manage all of your alerts from a centralized location on the console. Convenient “Chart” buttons may be used to open the chart where the alert was created.
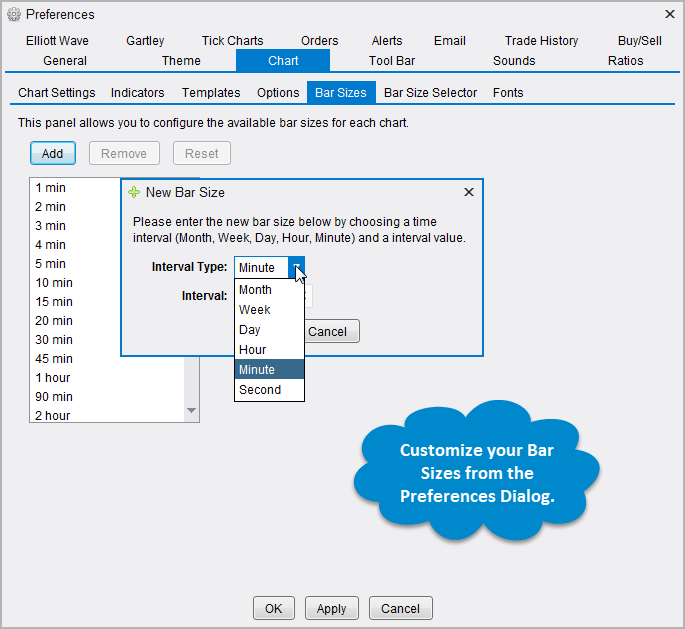
MotiveWave comes with several built-in Bar Sizes and Types including:
Custom Bar Sizes
MotiveWave is initially configured with common bar sizes. You can create custom bar sizes to suit your specific needs.
Bar Size Selector
Use the convenient Bar Size Selector at the bottom of each chart to quickly switch between bar sizes. Customize the selector to have the bar sizes that you regularily use.
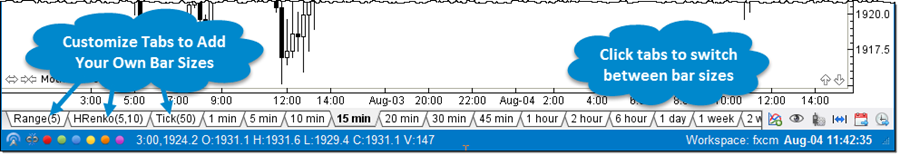
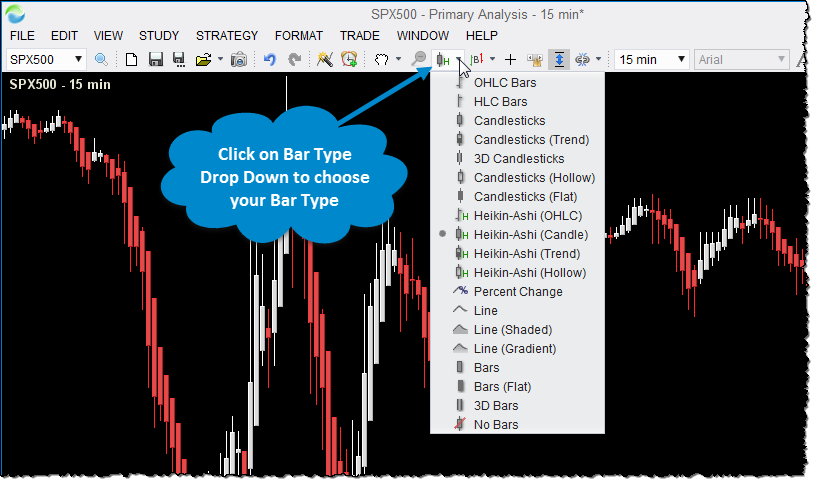
Bar Types
Several different types of bar types are provided to suit your needs including: OHLC, HLC, Candlesticks, Bars, Line, Heikin-Ashi.
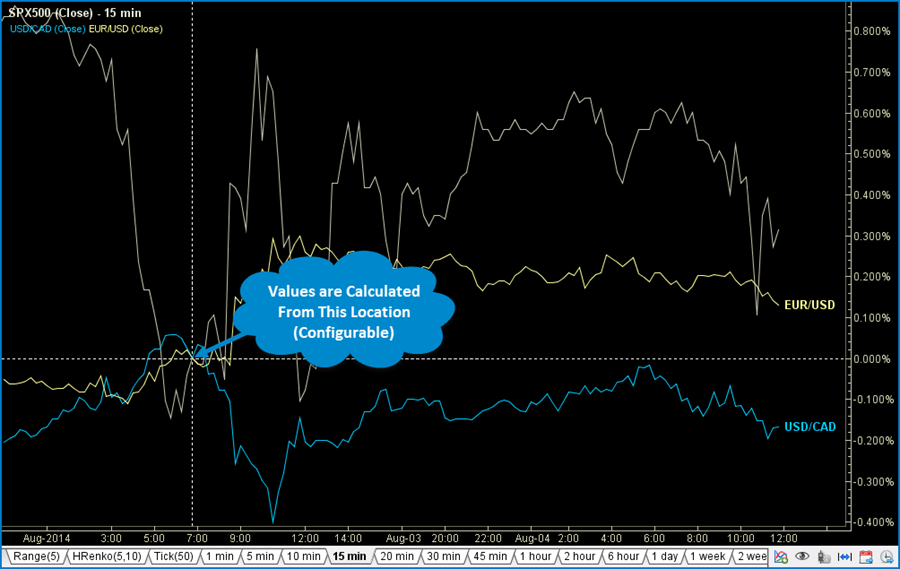
Percent Change Charts
Optionally, closing prices can be plotted as a percentage of change from a specific bar. Use the Instrument Overlay to compare the relative movements of several different instruments.
MotiveWave offers several quick and convenient ways to place/manage orders and open positions directly from a chart.
Price Axis Trading
Place orders directly from the price axis with a single mouse click. Limit Buy/Sell orders can be placed at a specific price by clicking above or below the current price. Keyboard modifiers such as “Ctrl”, “Shift” or “Ctrl+Shift” can be used to place specific types or combinations of orders when clicking on the price axis.
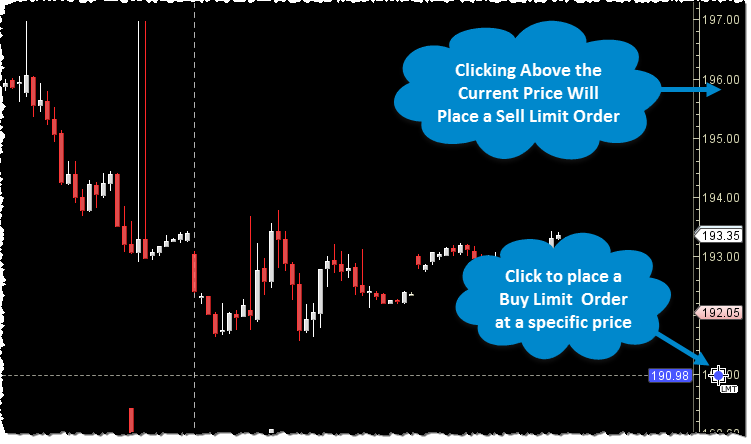
Orders can be adjusted or cancelled directly from the chart. Just drag a label to adjust the price or click the ‘C’ button to cancel an open order.
Trade Panel
Use the Trade Panel for more complex order management.
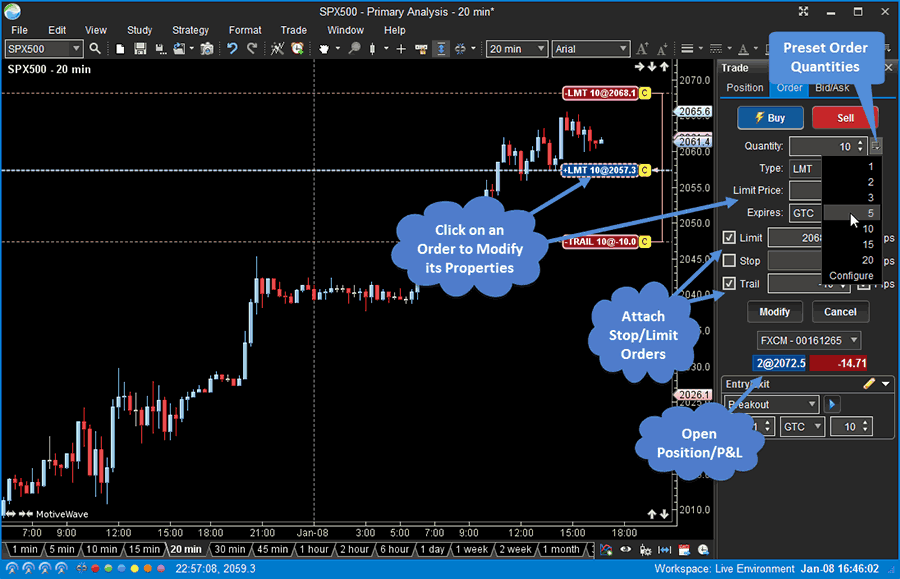
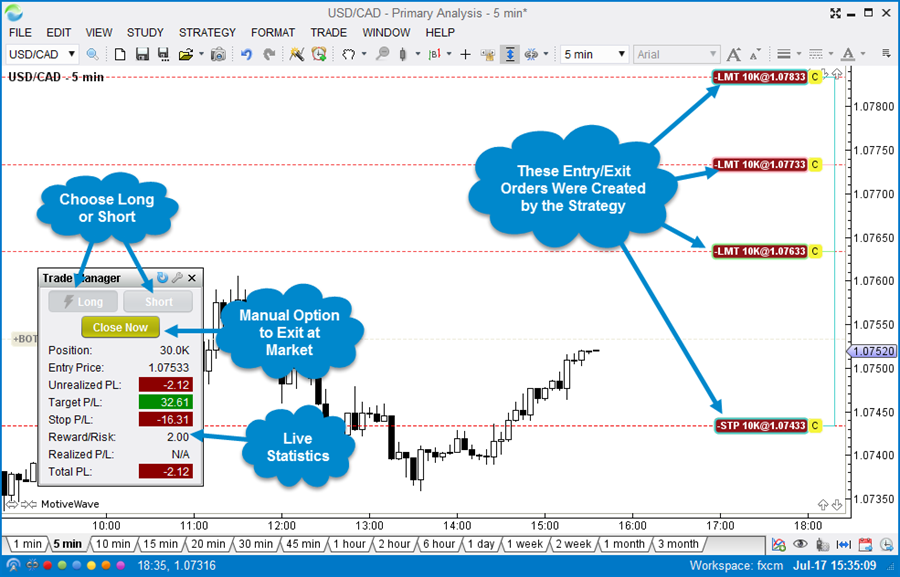
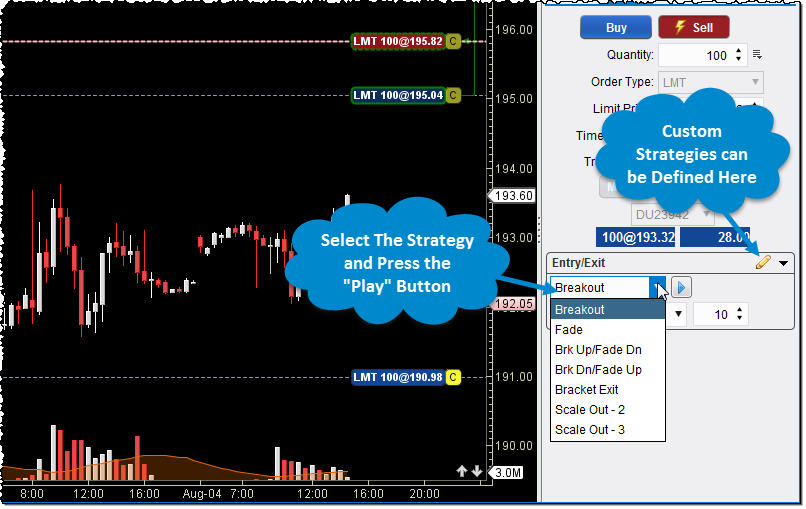
Entry/Exit Strategies
Entry/Exit Strategies provide a more sophisticated way to place combinations of orders for entering and/or exiting a position. MotiveWave comes with several built-in strategies including: Breakout, Fade, Brk Up/Fade Dn, Brk Down/Fade Up, Bracket Exit and Scale Out.
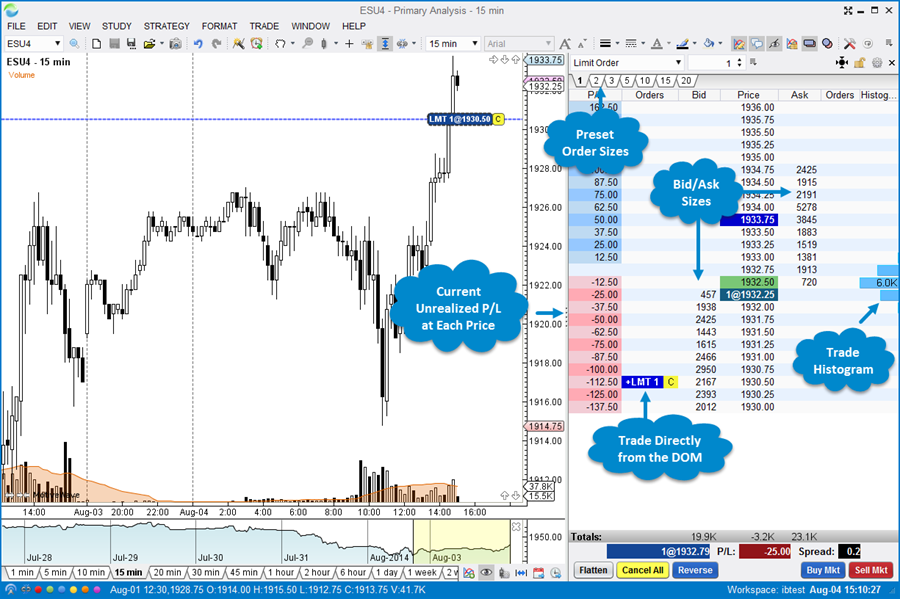
The Depth Of Market (DOM) panel displays bid and ask sizes beyond the best bid/ask in a tabular format. Orders can be placed and managed directly from the DOM and current profit/loss of open positions are displayed for each price level. The DOM may also be opened in a separate window for convenience.
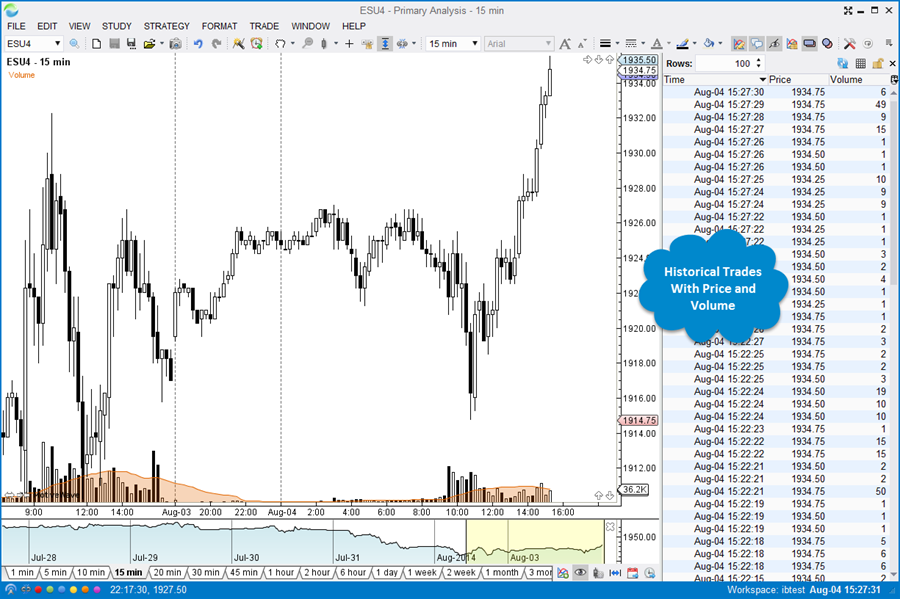
Display historical time and sales information by using the Time and Sales panel directy from a chart.
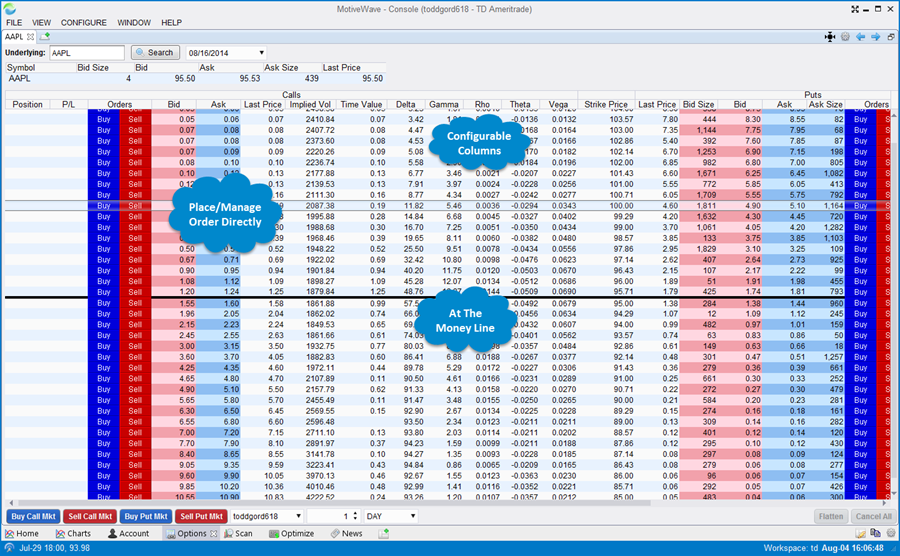
Trade options using our convenient Option Chain feature.
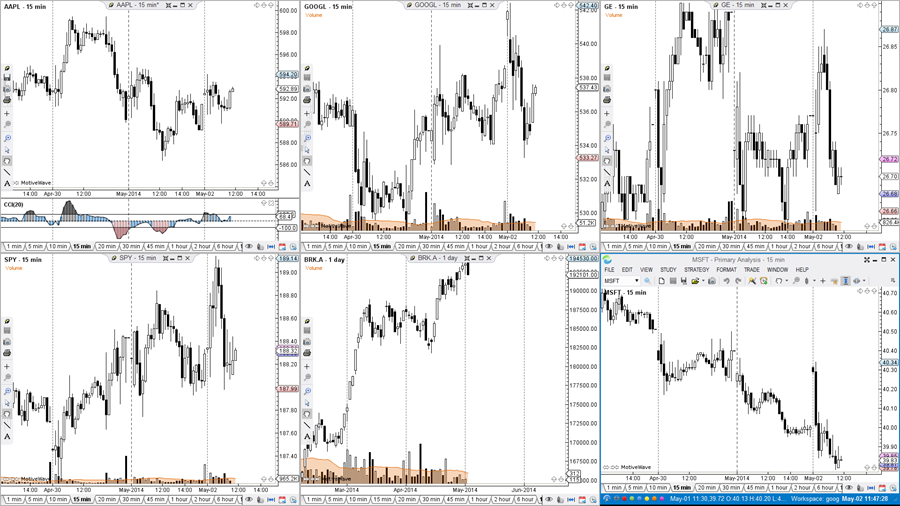
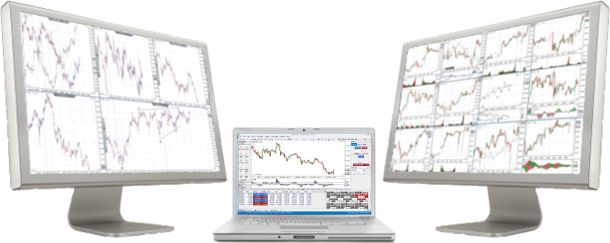
MotiveWave was designed from the beginning with Multiple Monitors in mind.
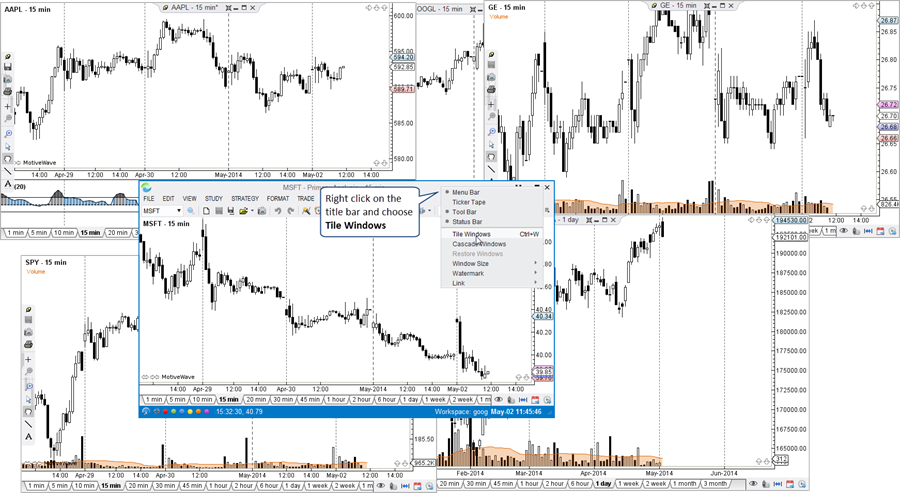
Tile Windows
Use our unique Tile Windows feature to organize your charts on a specific monitor. Just right click on the title bar and choose “Tile Windows”. The chart windows will be organized on the monitor to optimize the screen space.
Before Tiling
After Tiling