
Good Friday Holiday Trading Schedule (2024)
From the CME Globex Control Center, here is the summary of KEY changes, per CME market segment Thursday March 28, 2024...
![]()
MultiCharts is an award-winning trading platform. Whether you need day trading software or you invest for longer periods, MultiCharts has features that may help achieve your trading goals. High-definition charting, built-in indicators and strategies, one-click trading from chart and DOM, high-precision backtesting, brute-force, and genetic optimization, automated execution, and support for EasyLanguage scripts are all key tools at your disposal.

2012 t2w Members’ Choice Award
2011 t2w Members’ Choice Award
2013 Technical Analysis of Stocks and
2012 BMT Best Of Trading Award

MultiCharts’ strength is in its features, flexibility, and commitment to following industry programming standards. MultiCharts provides all the necessary features you may need in a trading platform. Our features allow you to create sophisticated trading strategies for your trading. Our flexibility allows you to choose the optimal data vendors and execution gateways. MultiCharts is also compatible with the industry-standard EasyLanguage developed by TradeStation.
Take control of your trading and act quickly when you see an opportunity – place orders in seconds through our new Chart Trading and DOM. It’s simple and intuitive, you can click or drag-and-drop orders onto your chart.
MultiCharts features many tools to help you achieve your goals – Chart Trading, Trade Bar, Order and Position Tracker, Depth of Market, Automation of Entries and Exits, and Symbol Mapping.

To make the right choice it is equally important to see the small details and the big picture. In MultiCharts, you can easily perform multi time frame analysis without cumbersome extras, such as custom DLLs and global variables.
Innovative object-oriented user interface sets MultiCharts apart from conventional charting software. You get an intuitive, easy-to-use application, which dramatically reduces your learning curve.
To interact with any object, such as data series, price scales, or chart background, simply click on it. The appropriate menu will appear—giving you only the relevant options. There is no need to spend time going through a complex menu structure; you are only a click away from anything you want to do. To move an object, such as a toolbar or a data series, simply click, hold, and drag. Additionally, you can stretch or compress a scale with a click and drag.
You can customize the look of MultiCharts from the overall appearance to the tiny details. You have full control to focus on the important data without overcrowding it with excess information.
Standard chart resolutions include both time-based and count-based options. Time-based choices include anything from seconds to years. Count-based resolutions are presented by ticks, number of trades, number of contracts traded, price range, and number of changes options.
Our trading platform allows you to set the price scales to match the type of analysis. You may choose between linear or semi-log axes for drastic price movements; two separate vertical scales, one for indicators and one for price movements; or even no vertical axes at all.
When working with charts, the ability to quickly pinpoint the exact price is critical. The Data Window remains on the side of the screen, showing you the current market situation. However, if you need to study a particular area on a chart, the Hint Window conveniently appears at the tip of your cursor.
You can display data series using either local or exchange timestamps. Also, in addition to hundreds of existing trading sessions, you can create custom ones to suit trading any instrument and in any time zone.
Volume Profile is a vital tool that shows the most traded prices for a particular time period. It plots volume as a histogram on the price bar, so you can see the levels where you need them.
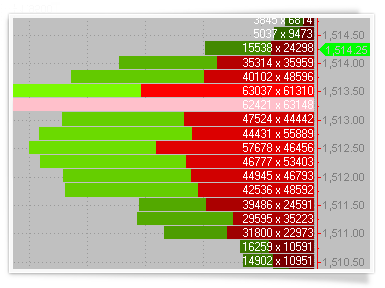
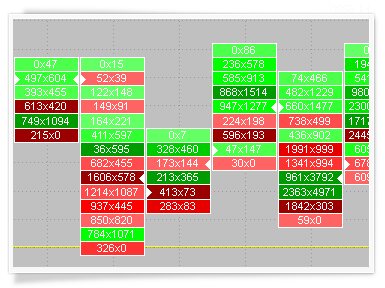
Volume Delta helps you keep track of trades that were completed on ask or bid prices in real-time. It plots a series of boxes with volume displayed inside them.
Knowing if there are more buyers or sellers at particular price can be an important indication of where the market is going. Cumulative delta plots the difference between asks and bids to give you that info.
Monitoring and tracking your opportunities
For example, you want to find all symbols that have oversold recently. The logic is that these instruments will be below their normal value and they present a potentially profitable opportunity. To do this, simply add symbols that interest you into Pre-scanning list, insert a pre-built or custom indicator, and specify the threshold value.Those symbols that satisfy the conditions will be shown in Watchlist window for updating in real-time.
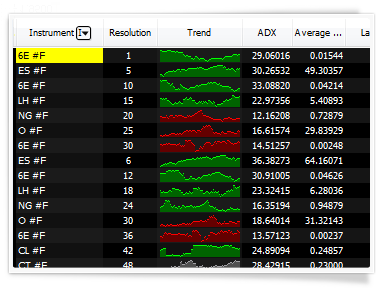
You can use different resolutions in different rows. For example, you could have the same symbol in tick, minute and day resolutions to monitor different trends. For even more flexibility each row can have its own session template and a unique number of bars a study will reference.
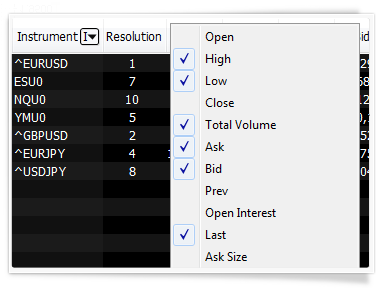
20+ important data fields
Open, High, Low, Close, Total Volume, Bid, Ask, Open Interest and other important data fields can be removed and added in seconds.
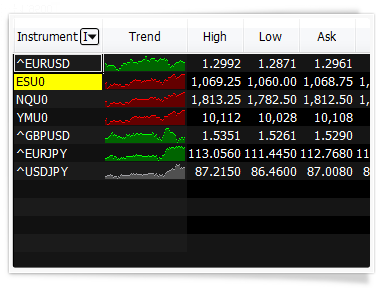
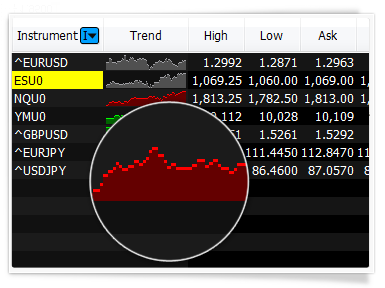
In addition to symbol linking, which allows you to change chart contents with a single click, MultiCharts has a unique feature called Market Trend Histogram. This allows you to see market dynamics without building a chart, but if you can still make a full-sized chart with one click if needed.
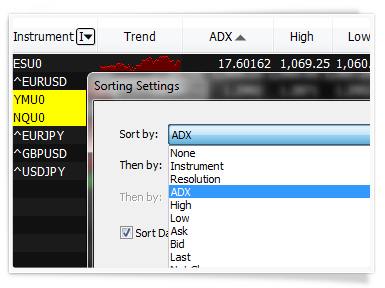
Scanner can automatically re-sort symbols either on a per-second basis or by a user-defined timer. Since you can sort according to any criteria available, this will help find trading opportunities in a timely fashion.
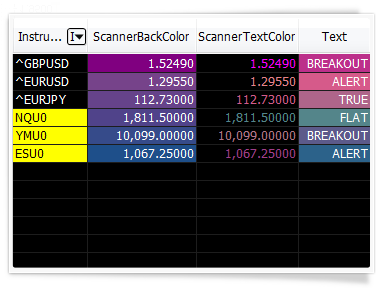
In addition to hundreds of studies that come with the trading platform, you can create your own, change existing ones and import from a variety of sources. Scanner’s distinctive feature is that you can change cell background and text coloring based on your personal criteria, and even have script-driven text generation in the Scanner cells.
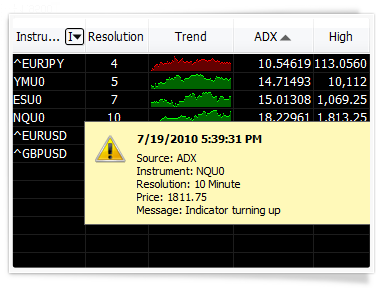
You can create custom visual, sound, and email alert for one or all symbols. Scanner alerts work the same as they do on regular charts.
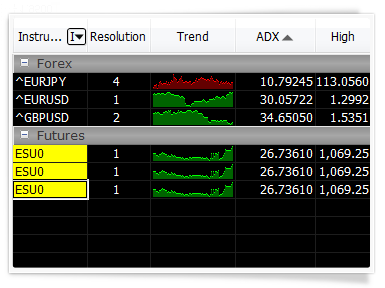
You can visually group symbols according to any criteria. An important distinction of having a group is that sorting is realized within each individual group. This means you can select important sectors of the industry, or interesting stock groups, and see which one tops the others. Groups can also be minimized and restored at will.
Monitor thousands of real-time or end-of-day symbols in each Scanner window. You can even mix instruments with different resolutions and from different data feeds.
Built to minimize your computer’s efforts
Since our Real-Time Market Scanner was built to use modern multi-threading architecture, it can use multi-core and multi-CPU computers to their full potential. This allows you to create very CPU-intensive workspaces with thousands of instruments and watch them in real-time without gaps or lags.
64-bit version removes all memory limitations
The 64-bit version of MultiCharts can take advantage of powerful computers to the fullest extent by using all available memory. This means you can add a lot more than 5,000 symbols per scanner window, making it a much more powerful tool.
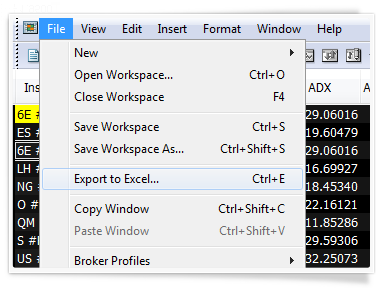
After finding the necessary symbols in the large list, sometimes it’s necessary to export data you find to Excel. MultiCharts can do this with one click.
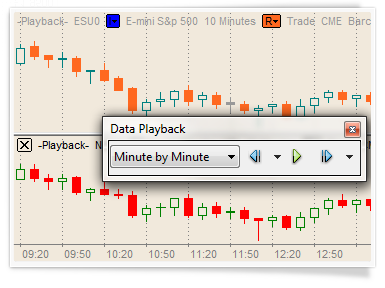
Market replay is a great way to learn about trading without risking your money. This feature is especially important for discretionary traders who use price patterns and other methods, which are difficult to incorporate into trading models and strategy trading. For technical information on this feature look at the related Wiki page.
Market data replay can playback historical data at any speed. You have complete control over how quickly market changes are displayed. For example, you can playback a month of minute data in just a few seconds.
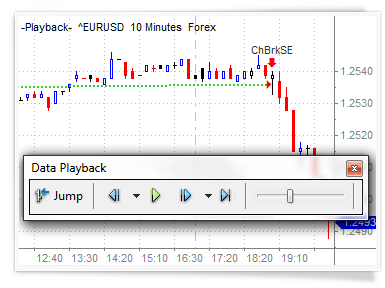
We are confident that our trading software has the best market playback in the industry. In addition to all features that other charting software offers, MultiCharts allows tick-by-tick replay. In essence, this recreates a complete real-time market picture.
Simulate accurate real-time trading
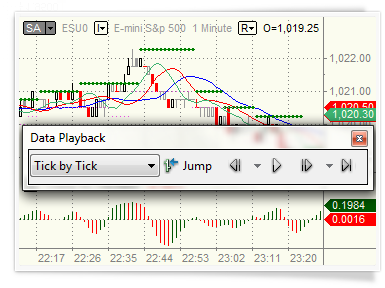
Our goal was to create a simulation that resembles real-time trading as closely as possible. If you are playing back minute data, other trading software simply draws minute bar after minute bar, while losing the information about how it was created. MultiCharts constructs each minute bar out of ticks to reflect actual price movements within each minute. MultiCharts can also recalculate your chart indicators on each tick, keeping you synchronized with the real market situation. As a result, you will not lose out on opportunities that exist within bars, so you can make realistic decisions as if you traveled to the past.
All market playback controls are located on a conveniently located toolbar. You can specify the exact starting location, choose which base resolution will be used for chart playback, and control rewinding and fast-forwarding—all with a single click.
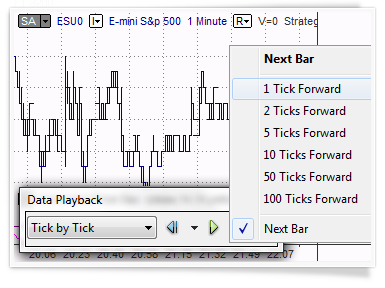
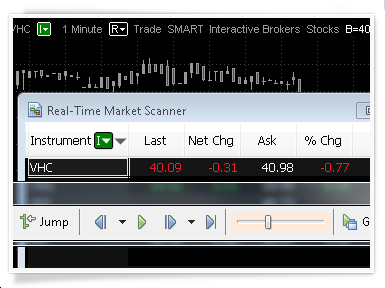
You can jump any number of ticks backward and forward on your intraday charts. For example, you might be playing back the S&P 500 and witnessing a slow market. You could easily skip forward until you see activity, instead of wasting your time waiting.
Ability to playback charts with multiple data series is very important. All symbols will be precisely synchronized according to time, so you get an exact picture of how data arrived throughout the day. Let’s say you have several symbols, even from different data providers, all on the same chart. You want to see how their price movements correlate to each other. This opens up new possibilities of analysis, new insight.
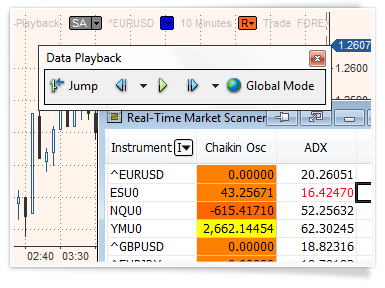
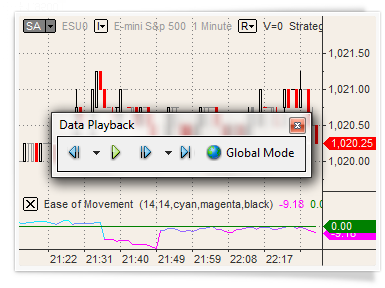
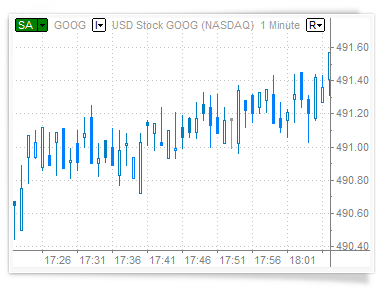
Global Mode gives you the ability to playback an instrument in several places at once. For example, you might want to watch the Market Scanner and each of the charts where you’re following Google. Starting point, base resolution, and playback speed will be the same in all the windows that you are playing back.
Global Mode
Imagine that you have Google plotted in several charts, but each window has different technical indicators and strategies. With Global Mode you can replay all the charts at the same time and see how different studies are performing.
You can combine Scanner windows and Playback to practice filtering through many updates and finding opportunities. You should use the 64-bit version of MultiCharts because of the huge amounts of data involved.
Data playback in Market Scanner
Since indicators can be easily applied in the Scanner windows, traders often group their symbols into groups and filter according to criteria presented by indicators they insert. Once an opportunity presents itself, it’s easy to open a chart through a right-click and look more closely at the action, or place an order. Data replay in the Scanner can help practice catching those moments of opportunity when certain symbols are prime for trading.
MultiCharts is perfect for people without any programming experience. It uses a programming language designed for trading rather than relying on a conventional programming language – it’s very easy to use.
PowerLanguage is an evolution of EasyLanguage
Many people have tried Strategy Creation Wizards, discovering they lack flexibility and are useful for only very basic tasks. On the other hand, professional programming languages, such as ‘C’, ‘C#’, or ‘Java’, have a very steep learning curve. While powerful, these languages require a lot of time and extensive study to express even simple ideas. PowerLanguage is an evolution of EasyLanguage. It is the best of both worlds, allowing the creation of simple strategies without requiring any special education. Simply looking at the built-in scripts is enough to understand the logic and begin programming. If a strategy requires complicated logic and thousands of lines of code, then PowerLanguage has practically everything you need. If you need something that is not available, then a DLL in any other programming language may be used.
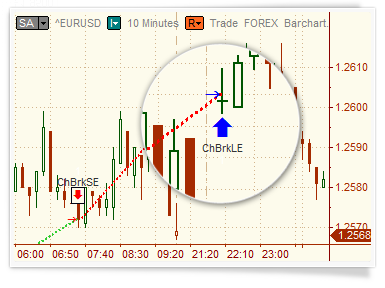
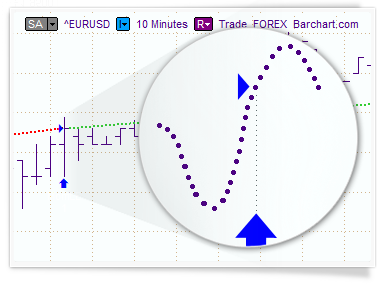
MultiCharts allows you to build your strategy out of many trading signals, without any additional programming. For example, you can make a strategy by combining the built-in Channel Breakout Long Entry with a Profit Target Long Exit.
PowerLanguage is flexible: Strategies can be based on events (new market data) or on changes in market position at the broker. A strategy can take both into account, resulting in a complete picture.
Strategies based on market data
Usually strategies are calculated based on the arrival of new market data, which is quite logical since strategies must monitor changes in the market and react to those changes. MultiCharts can recalculate a strategy on every tick, on a bar close, or based on a user-defined timer.
Strategies based on broker events
Sometimes changes in a brokerage account need to be considered during automated trading. Trading strategies in MultiCharts can also react to changes in market position and be triggered at a particular level.
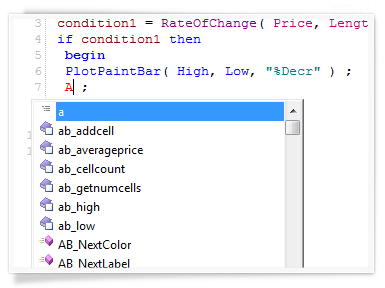
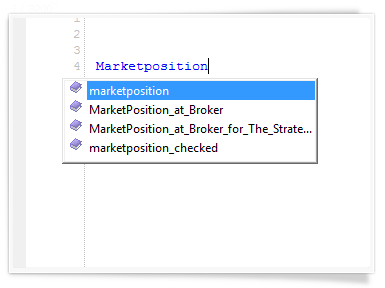
PowerLanguage Editor has syntax highlighting, ‘IntelliSense’ (auto-completion) and a built-in syntax checking. Keyword Reference is conveniently located directly in the Editor.
Independent studies state that PowerLanguage works faster than EasyLanguage and also has significant advantages over other competitors.
Your computer’s processor governs speed
During optimization MultiCharts uses all available cores on your computer, which results in a dramatic speed increase. For example, a 16-core computer will perform optimization 11 times faster than a single core.
Behind-the-scenes binary code for ultimate performance
High calculation speeds are possible because code is compiled, not interpreted. Your code is translated into binary language (0 and 1), which automatically results in a dramatic increase in performance.
Carefully crafted architecture for productivity
Our engineers spent hundreds of hours optimizing MultiCharts’ architecture, resulting in greater productivity for MultiCharts users.
MultiCharts is a solution created specifically for strategy development and backtesting. Our philosophy is that strategy backtesting should be as realistic as modern technology allows – that’s why we use multi-threading and 64-bit technology.
Our backtesting software considers the following essential factors: liquidity, tick-by-tick price changes, ask-bid-trade price differences, commission, slippage, initial capital, interest rate and trade size.
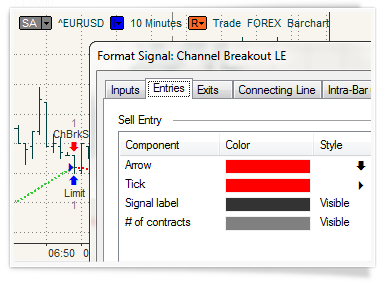
You can change how your signals appear on your chart—in just a few clicks. Exit orders can be connected by a visible line to all related entry orders—the line will be green if the trade was profitable, red if not. If you don’t like those colors, or any other visual aspect, you can easily
change it.
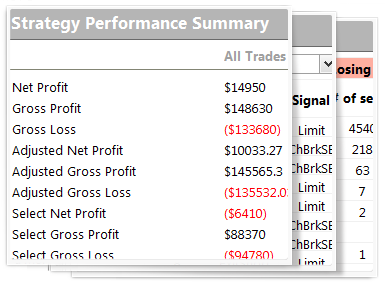
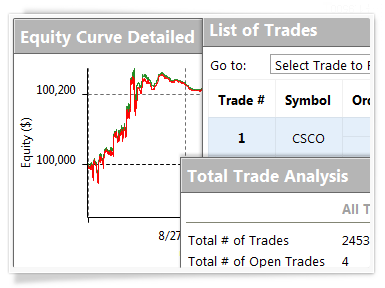
At your fingertips, you have more than 200 performance measurements available. Some of the most useful ones are located in strategy performance summary, performance ratios, time analysis, list of trades, total trade analysis, outliers, run-up and drawdown, trade series analysis, and periodic analysis.
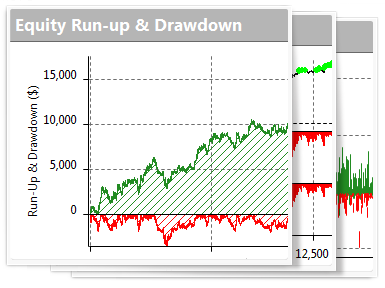
MultiCharts includes 28 interactive graphs to display relative and absolute values. Drawdown, for example, is shown in relative values, which allows you to see the realistic picture.
MultiCharts provides speed and efficiency. Our philosophy is that time should be spent perfecting strategies and trading ideas, as opposed to looking up performance information.
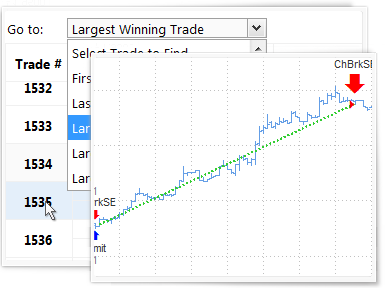
One-click charts
In MultiCharts, looking up the necessary trade takes just one click. You have 16 qualifying parameters to choose from. As soon as you identify the trade that interests you, all it takes is a click to display it on a chart. In this way, you see the trade in the report, and the graphic chart representation, at the moment when the trade was created. This allows you to quickly identify flaws in entering and exiting methods and improve trading logic.
Strategy optimization is the search for optimum parameters for predefined criteria. By testing a range of strategy input values, optimization helps select values that correspond to optimal strategy performance based on historical data.
Strategy optimization is done to find good parameters, and eliminate bad ones. Exhaustive optimization systematically goes through all potential combinations as it searches for the solution with the highest results for the criteria you chose.
Maximum speed of optimization
You can find inputs that maximize net income, minimize drawdown, or result in fewest trades. The amount of time the exhaustive optimization feature needs to find the solution relates directly to the number of possible combinations it needs to test—the more combinations you have, the longer it will take. If only a few parameters are tested for a short range, this method is definitely optimal for finding the best inputs. Also, in MultiCharts optimization is spread across all available CPUs, which means your optimization speed will increase with the number of cores in your computer. This method of spreading the work across CPUs is called multi-threading.
Each optimization type has its benefits and drawbacks. You must choose the right tool to get the job done, and find the result you need.
Different tools for different needs
If you are testing many possibilities, exhaustive optimization takes a very long time—even with multi-threading. The advantage of exhaustive optimization is that it is guaranteed to find the absolute optimal inputs in the testing range, but the drawback is that it takes a very long time if many possibilities are tested. Therefore, it should be used where the number of possibilities is relatively small, or where you must find the absolute best solution. Another nuance is that the absolute best inputs might actually be an outlier, which does not result in good performance on a consistent basis. Genetic optimization addresses this issue because it performs strategy optimization differently.
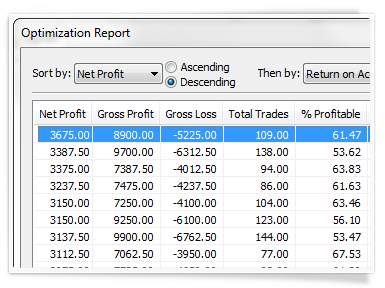
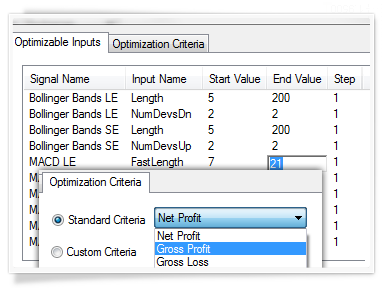
This report shows the optimization results, and you can filter output combinations by one or more criteria. For example, to find a strategy with the maximum net profit and minimum max drawdown—first sort by net profit in ascending order and then by drawdown in descending order.
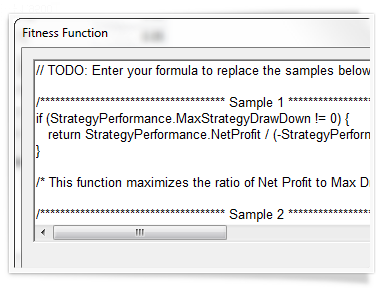
You can set your own custom criteria for which for strategy optimization. Custom criteria can be written directly in C#, VB.NET, or in Java script.
Optimization with multiple conditions
With this feature you can optimize using several conditions, as opposed to just one. For example, you can find a strategy that combines the greatest profit, lowest drawdown, and the highest percentage of profitable trades. You can use custom fitness function optimization in regular and portfolio backtesting—as well as with genetic and exhaustive trading system optimization.
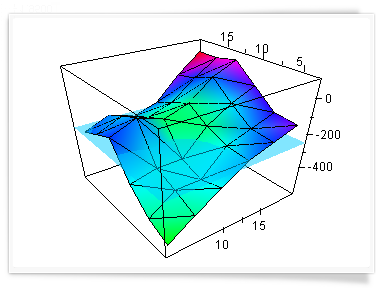
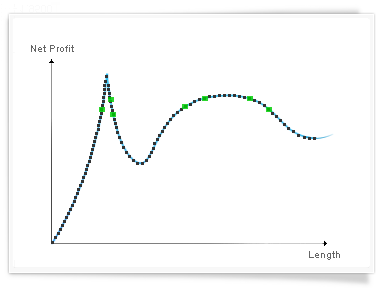
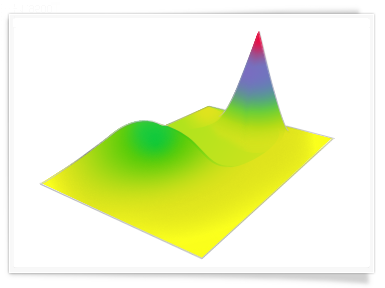
3D optimization graphs give visual representations of how the strategy parameters affect trading performance. The 3D graph reveals most robust parameter zones, and is a great tool for avoiding over-optimization, which also known as curve-fitting.
Avoiding over-optimization
A strategy that has abrupt performance breakdowns with only small parameter changes cannot be considered robust. You can superimpose results of different optimizations onto each other to compare results, and see if the optimal inputs you found are confirmed by other tests. You can use superimposition to compare genetic and exhaustive optimization results, and you can evaluate how robust your findings are. 3D surfaces can be drawn by any criteria available in the optimization report—for example net profit, percent profitable, and max drawdown. Relevant input and output values are displayed when the mouse cursor hovers over a particular point on the graph’s surface.
This strategy optimization method makes it possible to find workable solutions amongst billions of combinations, whereas exhaustive optimization would take an unacceptably long amount of time.
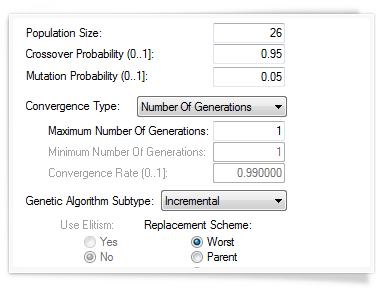
Based on principles of biological evolution
Genetic optimization does not try every possible combination. Instead, it uses complex algorithms that use principles of biological evolution. It randomly picks a sample of inputs, and tests for positive results. The best inputs are kept, and the worst ones are replaced with new random inputs—survival of the fittest. You can even customize your optimization by changing the number of generations, population size, and the convergence type
If the algorithm thinks it has found something good, it will start testing around the newly found peak to determine if this peak is an outlier. If this result is an outlier, genetic optimization leaves it and moves on to other areas.
More combinations equals better optimization
In fact, the more possible combinations you have, the better genetic optimization works. After you complete genetic optimization, you can test the inputs you found even more, with exhaustive optimization, walk-forward testing, or technical indicators.
Genetic optimization makes it possible to find new opportunities when creating trading systems, as opposed to fine-tuning an already existing system.
Systematically work through thousands of parameters
For example, you can apply many indicators to your chart—each one of which has literally thousands of parameters. Then you can check if these indicators help predict price patterns by including and excluding them by telling genetic optimization to turn them off and on systematically. You can then use these findings to filter out the indicators that don’t work, and keep the ones that do.

To fully understand how genetic optimization works, we recommend you read additional professional literature on genetic algorithms.
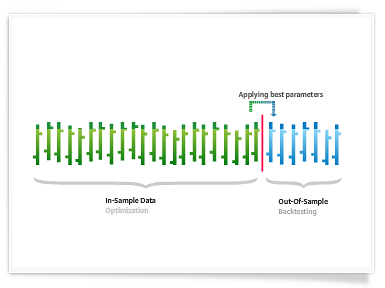
Walk-forward testing combines optimization and backtesting. During the testing, optimal inputs are tested against real market conditions to see how they would perform.
Preventing curve-fitting
First, the entire data series is broken up into smaller parts. A series of tests is done, and each test is done on a small portion of the whole data series (in-sample data). When optimal input values are found for that small portion, the software checks how they would have performed in the real world by applying them to data that was not part of the test (out-of-sample data). The tests continue to repeat until you have tested the entire data range. In the end, you are shown the results that performed the best under varying market conditions. This helps prevent over-optimization, also known as ‘curve-fitting’.
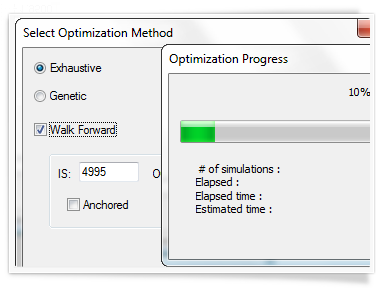
Walk-forward testing can be used with both exhaustive and genetic optimization methods. You can specify different sizes for your in-sample and out-of-sample data, and you can even display information in bars or days.
No jumping forward
There is also a modification to the walk-forward process, called the anchored mode. When you select the anchored mode, the in-sample data stays anchored to the beginning and gets longer for each test, instead of jumping forward. This is another way of making sure your results are robust.
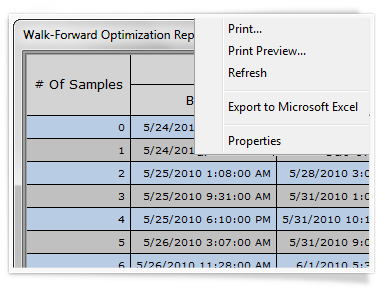
Export to Excel with one click
The walk-forward testing report can be exported to Excel with just one click. Then you can perform additional analysis on the data you found during the test.
The walk-forward testing report can be exported to Excel with just one click. Then you can perform additional analysis on the data you found during the test.
Orders generated by a trading strategy in MultiCharts are sent directly to the broker’s server. Then the broker responds with a message about the order status, and you can see on your chart if the trade was successful.
Stop watching the market
Auto trading is very convenient, because once you have written and tested your logic—you no longer need to constantly watch the market. Also, automated trading makes trading high-frequency strategies possible. With trading systems like these, manual order entry would result in unacceptably long delays, and it would not be possible to trade them.
MultiCharts supports a large number of trading gateways, and more are added in each new version. See the Supported Brokers page for complete details.
MultiCharts provides stable auto trading that can operate without constant monitoring. Your strategy has constant access to real-time account information and level 2 data, and it can automatically fix any possible asynchronization.
A characteristic feature of MultiCharts automated trade execution is that orders are sent at the close of the previous bar—instead of being sent at the moment when they appear on the chart. This approach ensures that prices, at which the orders are actually filled, correspond closely to the prices on the chart.
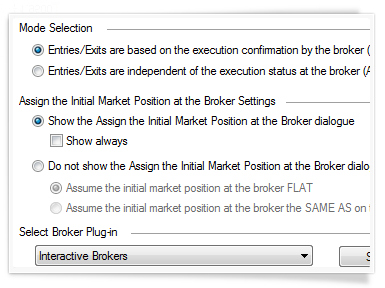
MultiCharts has two modes for auto trading: Synchronous and Asynchronous. Each one has its advantages and drawbacks.
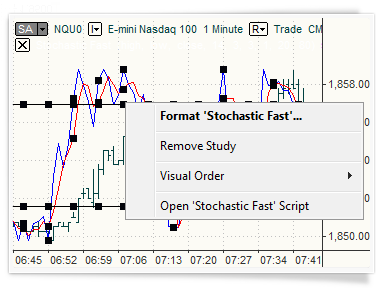
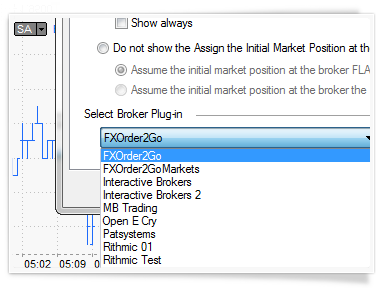
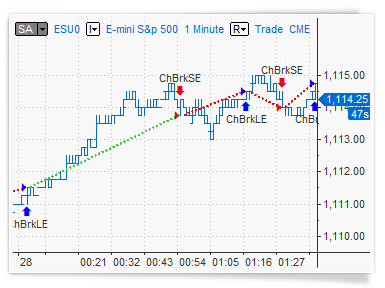
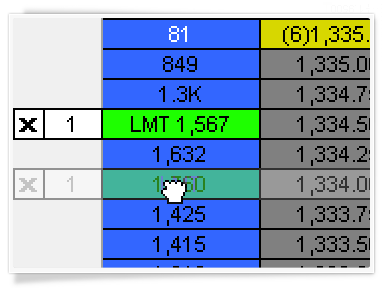
You can easily control auto trading with a switch conveniently located at the top left of your chart. Simply click it to turn auto trading on or off. If it’s green, that means you are trading live—if it’s grey, then you are in backtesting mode. Letters ‘AA’ on the switch indicate that you have asynchronous auto trading selected, and ‘SA’ mean you chose synchronous auto trading.
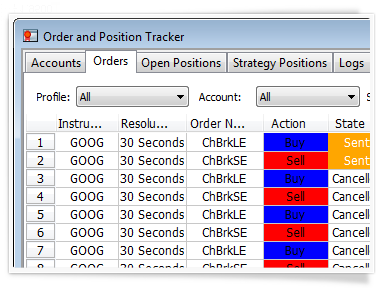
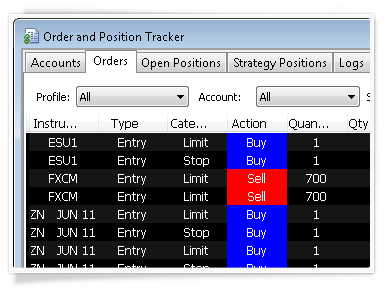
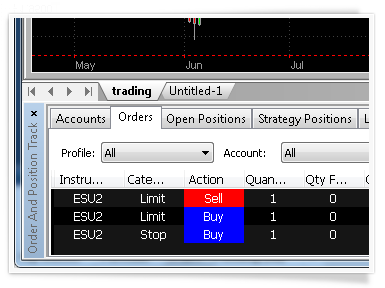
An important feature of MultiCharts is called the Order and Position Tracker. In this separate window, you can easily view information about strategy orders and open positions.
Portfolio backtesting means applying one or more strategies to many instruments at once—testing on historical data and gauging performance as if all symbols were traded with these strategies. Different symbols can even have different resolutions during the testing—one tick, three minutes, nine days, or others.
It’s very easy to reach critical mass with the huge number of combinations; 64-bit MultiCharts version is essential for portfolio backtesting.
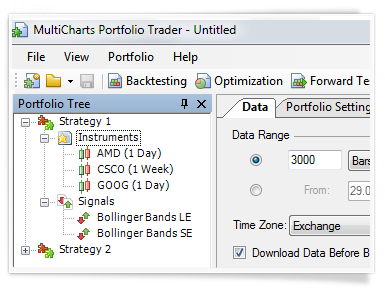
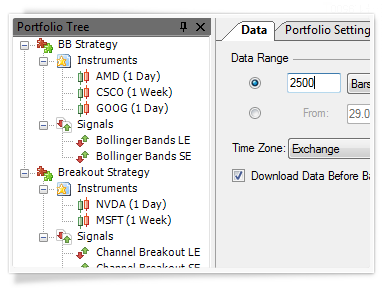
Portfolio Trader is very flexible in letting you create a several strategies and combine them in many ways. Symbols can be divided into groups, and each group can have its own strategy. For example, you can have a “Rotation” and “Spread” strategies applied to different groups of instruments in your portfolio.
The overall performance of your portfolio
For example, you could have one trading system that trades stocks and another that trades futures. The performance of each strategy will impact your overall portfolio performance.
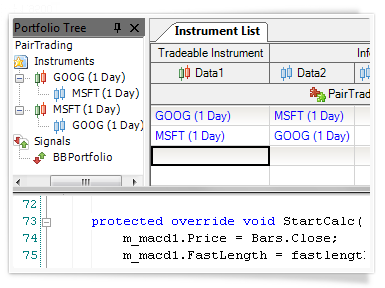
Your trading strategy can reference up to nine other instruments in order to make a trading decision on any one tradable symbol. This opens new opportunities of testing strategies such as statistical arbitrage or pair trading.
Achieving synchronization
For example, let’s consider a pair trading strategy. Pair trading means that you buy one instrument and sell another at the same time, and vice versa. When one of the pair is bought or sold, your strategy needs to know exactly what’s going on with both symbols. If your pair is Google and Microsoft, you would enter GOOG as symbol one and MSFT as symbol two. Then you would add MSFT as data one and GOOG as data two. This way each instrument in the pair is actively referencing the other instrument—and you achieve complete synchronization.
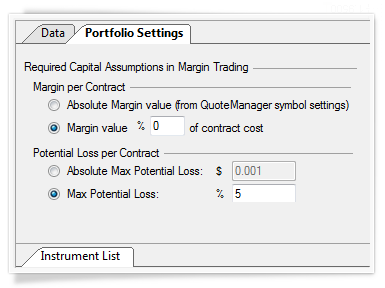
Considering real-life constraints is critical for creating successful portfolio trading strategies. During portfolio backtesting, trading signals often need to be prioritized because there is not enough money in the account to place all orders. Your strategy might always buy the cheapest instruments first, or you might want it to always fill stock orders before futures orders.
Accounting for real-life situations
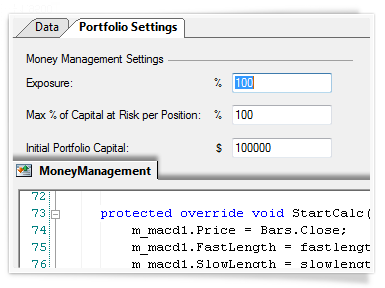
There are many constraining variables available, so you can make portfolio backtesting as realistic as possible. Initial capital, exposure, risk, and other parameters are all essential factors to consider.
Money management options can be easily changed through the portfolio backtester interface or by directly from your script.
MultiCharts portfolio backtesting report is an essential tool when evaluating how your strategies are doing. It is just like our regular performance report, but it features the ability to view breakdown by symbols or show a correlation matrix.
Portfolio optimization lets you find optimal parameters for each of your portfolio strategies—one at a time or all at once. Both exhaustive and genetic optimization methods are available in the portfolio backtesting engine. The 64-bit version of MultiCharts handles huge data needed for both tasks with ease.
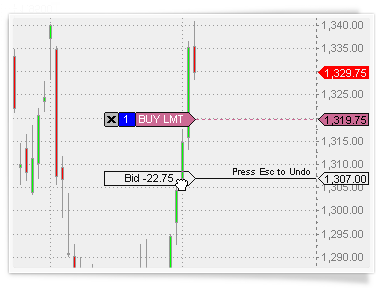
No need to worry about typing in the exact price – you can simply drop an order on the chart and you can always adjust it if you need to. You can move your orders around to match other price levels on your chart, such as breakout or support levels, or drag more orders. You can also drag-and-drop automation strategies to further enhance your trading comfort and speed.
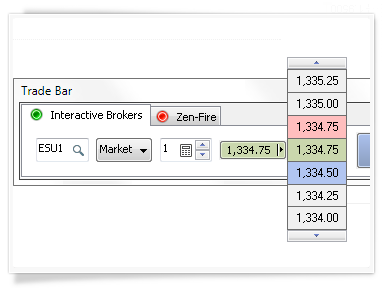
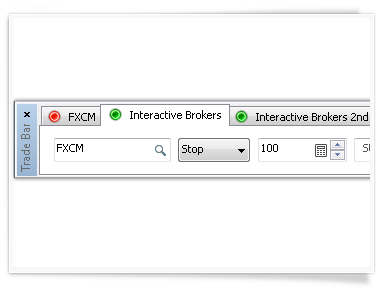
It’s simple and precise – you can type in the exact price, choose the order and buy or sell. This toolbar also has tabs, one for each broker profile you create. You can easily switch between different accounts, or even brokers, and trade what you need.
You see a detailed summary of your orders, positions and accounts across all brokers that you are trading. You can cancel or modify pending orders, or even flatten entire positions directly from this window. All information is in one convenient place, and you can sort and filter to zoom in on the pieces that you need. You can also export the reports from Order Tracker into Excel for further analysis.
![]()
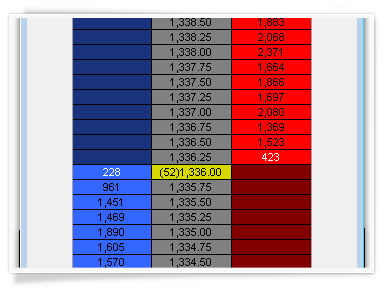
The DOM is an industry-standard tool that lets you see market depth and trade with one click. In MultiCharts you can see ten price levels each way, and apply entry and exit automation directly in the DOM window.
Sometimes there is no time to place entry or exit OCO orders by hand, so we built some automation strategies that you can simply drag-and-drop onto you chart. You can drop them onto any point on the chart, or attach them to a particular order or position.
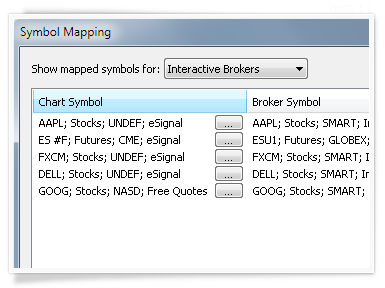
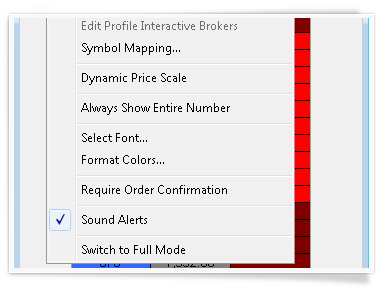
MultiCharts allows you to trade through any broker from any chart, but sometimes brokers and data feeds give different names to the same symbol. Symbol mapping lets you translate between the chart and the broker by filling out necessary details, and making the symbol understandable to the broker.
Now you can step away from the computer without missing a beat – convenient Sounds Alerts will tell you if an order was filled, position was opened or closed, or if your connection went down. You can also fine-tune them to your liking, and be free to do other tasks without having to watch charts all the time.
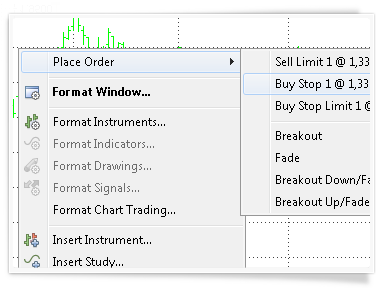
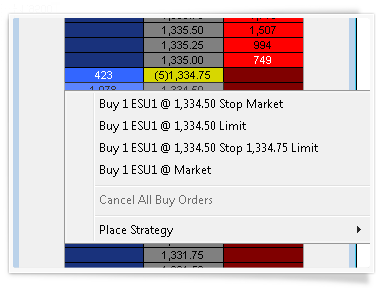
No more remembering prices to type them in later – surface of each chart tracks movements of your mouse and you can place orders at the exact levels you click on. Simply hover your mouse over the appropriate price, right-click and choose the order type and quantity.
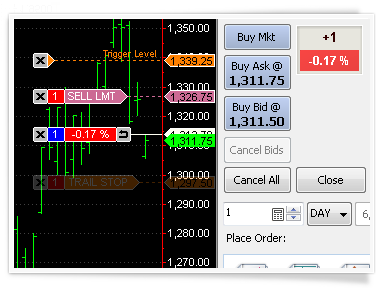
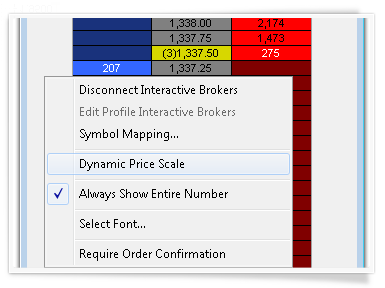
Context sensitive menus and orders
Nearly everything in MultiCharts is context-sensitive, not just the chart surface. Try right-clicking on various objects and only the relevant options will appear. For example, the Place Order menu option only appears when connected to a broker. Click above the price and see Sell Limit and Buy Stop options, but if clicking below the price see Buy Limit and Sell Stop options. Different controls only become active if they are appropriate.
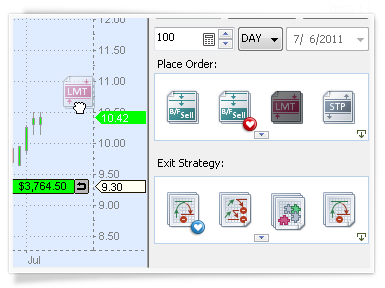
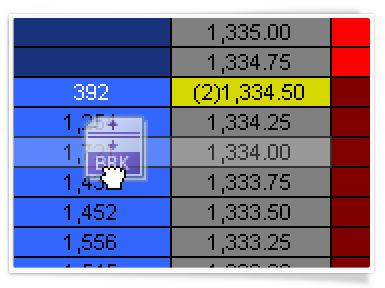
Visual trading is essential because most traders spot important points with their eyes – where a pivot will occur, or a breakout might happen. You can easily and precisely drag and drop orders.
To change where orders are located, simply drag them up or down. Don’t like the new location of an order? Simply press Escape and the order will return to its original position.
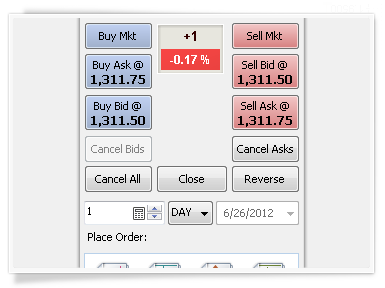
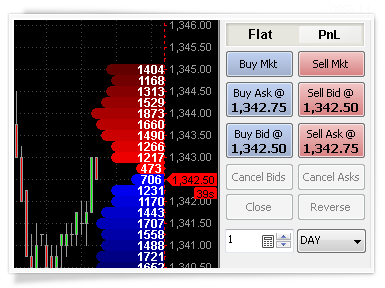
Apply any order or change any position quickly and easily using this carefully designed panel. An intuitive interface and color-coded buttons make things easy to locate.
Staying protected in a fast moving market is a must for all traders. Drag-and-drop entire strategies onto a chart – you can apply strategies to existing orders and/or to entire positions.
Sometimes data feeds and brokers have different names for the same symbol – and orders can get rejected for incorrect symbol reference. MultiCharts defines how an order will appear to a broker, so it is possible to use any combination of data feeds and brokers.
Trade through multiple brokers and accounts at the same time. It’s easy to use – simply create separate connections for each account.
Creating Broker Connections
All information about a particular broker is stored in a profile (we call them connections). Make as many connections as needed for a particular broker, or for different brokers. Separate connections can be used when managing or trading someone else’s account.
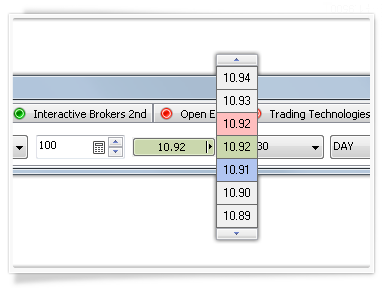
Simply pick which order to submit, enter the symbol, and type in the price – or use a convenient Price Locator to save time. You can also select the order type and how long the order will be active.
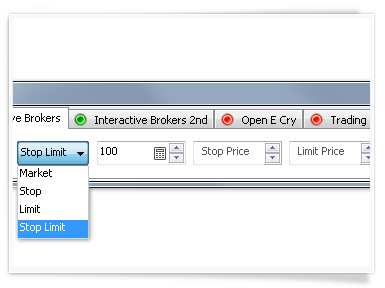
Different order types have different options – see only the ones that make sense.
Monitor information from different brokers at the same time all in one place and view account equity across all accounts.
Staying current is vital. Access continuously updated Profit and Loss across all positions. See which orders were submitted and which were filled – all in real-time.
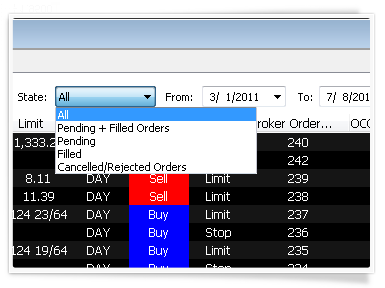
Find information by filtering reports by broker, by time filled, by order status, and other qualities. It’s easy and fast – just use the intuitive drop-down menus.
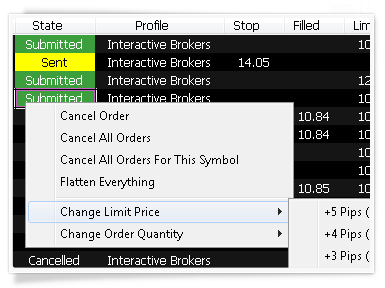
Don’t be limited to just watching orders, change positions as needed directly from the tracker. Cancel orders, modify existing orders, or flatten entire positions with a simple mouse click.
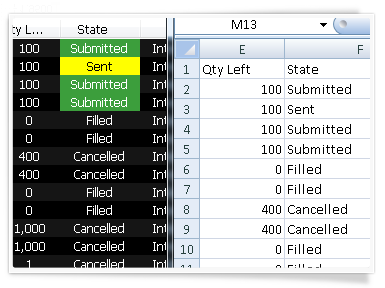
Analyzing completed trades is an essential part of improving trading skills. Save the complete trading report to Excel to perform further statistical or other types of analysis.
Logs of all messages from brokers are updated in real-time. If an order is not going through, then see exactly what’s going on so appropriate action can be taken.
Depending whether you want to always monitor your positions and accounts, the Order and Position Tracker can be docked to the main MultiCharts window. If docked, it will always remain visible and non-obscured by charts and other windows.
DOM in MultiCharts has two modes of operation: dynamic and semi-static. Simply choose the mode through a right-click.
Compact mode
Screen space is a prized commodity when you have many charts, scanners and DOM windows open at the same time. Compact Mode lets you save a little more by hiding some interface buttons, and leaving visible only essential ones. You can always switch to Full mode by right-clicking and choosing the appropriate option.
Semi-static and Dynamic
Semi-static DOM mode means the DOM window will re-center once the current price hits the upper or lower boundary of the window. A 5 second countdown precedes re-centering. Our DOM is semi-static because it will move without input from the user (i.e. if the price goes off the screen), which creates the possibility of making an error during input.
Dynamic DOM mode means the DOM window will automatically re-center after each new tick (price update) received. This mode is very useful for scalping strategies.
Traders enjoy the freedom to choose the mode that suits their trading style.
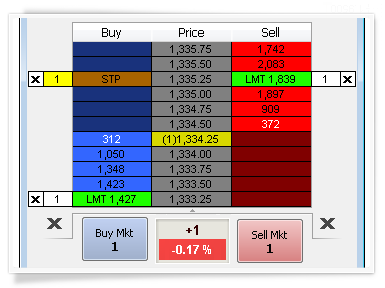
See ten price levels for both asks and bids, so you know the spread of bids and offers. A deeper DOM gives a better overview of the market.
Perform one-click trading with a mouse left-click, or use the mouse right-click to choose a precise order.
Visual trading is essential because most traders spot important points on a chart with their eyes, such as where a pivot will occur or a breakout might happen. It is easy to drag-and-drop orders precisely onto the DOM.
Order and strategy icons
Stop, limit, and stop limit orders are shown as small icons with appropriate names, and they can dragged to price levels since they are price orders. Market orders can only be entered using the blue (buy) and red (sell) buttons.
One-Cancels-Other (OCO) order groups may also be added to enter and exit positions. OCO orders consist of combinations of limit and/or stop orders, and if one is filled the other one is cancelled. OCO orders are also shown as icons, and will be discussed in more detail in the Entry and Exit Automation section.
To change the price where orders are placed simply drag them up or down. Don’t like the new location? Just press Escape, and the order will return to its original position.
Staying protected in a fast moving market is a must for all traders. It is easy to drag-and-drop entire strategies. Apply some strategies to existing orders or to entire positions.
In MultiCharts, DOM data is accessible from strategies, so you can take into consideration ask and bid size at different price levels automatically. Knowing how much is being sold or bought at which prices can help determine important bullish or bearish trends.
Analyze subtle differences between demand and supply
In MultiCharts you can easily access level 2 data from your strategies. Shifts between the number of contracts being bought or sold at any given second can often indicate important changes in a larger trend. Seeing only current ask and current bid prices will only tell you the spread, but it won’t tell if there are more sellers than buyers, for instance. Having access to ten levels of depth on each side through the strategy opens a wealth of opportunities to catch those moments when volume changes direction and make necessary conclusions.
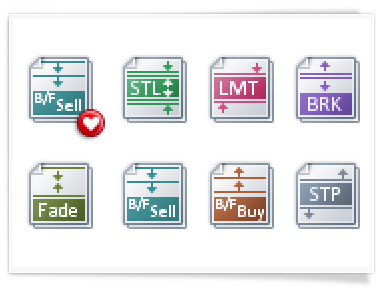
We have designed some common ways to enter positions and added them as convenient icons that a trader can drag and drop onto a chart.
Protection is essential against unwanted market movements and to try profiting from them if possible. Some traders think that the exit strategy, exiting a position properly, is more important for consistent results than the opening strategy.
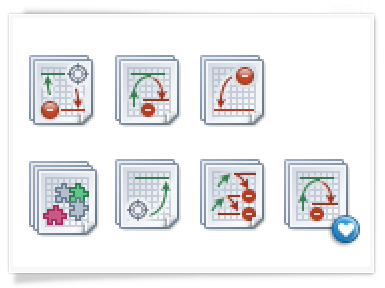
Exit strategies are essential
Exit strategies are designed to protect against sudden market movements and to exit a position in a structured and organized fashion. Exit strategies can be used to manage risk, scale into and out of positions, and to leave the computer while trades are on. Just like entry strategies, these exits are OCO groups consisting of limit and/or stop orders. It is very easy to drag-and-drop exit strategies to existing orders, apply them with a mouse right-click or auto-apply them to every new order placed.
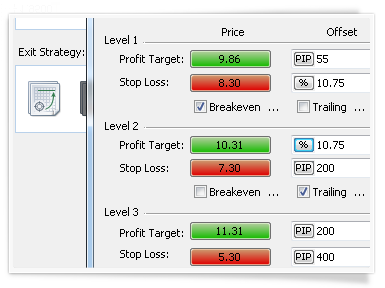
There are currently five exit strategies: Brackets, Breakeven, Trailing Stop, Stop Loss, and Profit Target.
MultiCharts uses a ‘building block’ approach to construct automated exit strategies; a trader can assemble exit strategy components or use larger blocks that have things pre-made for convenience. For example, a breakeven can be combined with two stop losses or utilize brackets to have a profit target placed automatically with a stop loss.
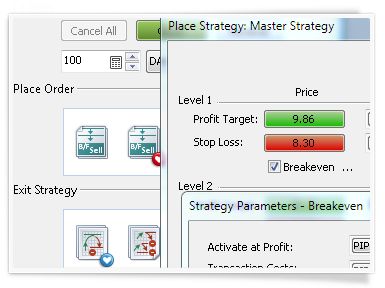
The Master Exit Strategy is a multi-level strategy where all components interact closely with one another. Multiple bracket levels, trailing stops, breakevens, and all levels may be set so they are constantly synced with one another. It’s an essential tool for scaling-in and scaling-out of positions and for pyramiding positions.
This strategy cannot be combined with any other exit strategies because it incorporates all of them. Only one Master Exit strategy may be set per chart. Define the entire exit system before entering a position, planning it all out ahead. Set multiple bracket levels (which are made up of multiple stop losses and profit targets) and define breakeven and trailing stop levels.
The key functionality of the Master strategy (aside from piecing all components and predetermining levels in advance) is that all levels are constantly synced. If, for instance, some contracts are transferred from one bracket level to another, the same adjustment will be made automatically on the other side of the bracket as well. If there is a partial fill, then the other side will adjust accordingly. If an entire level is cancelled, the strategy will get rid of all unnecessary components, allowing the trader to focus on the market.

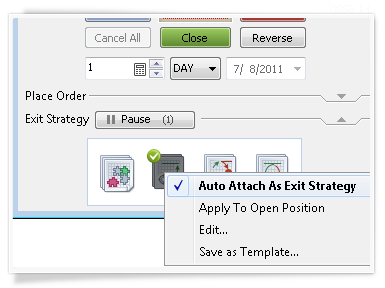
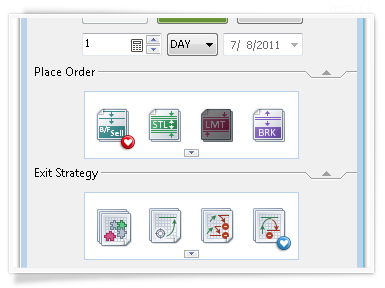
Stay protected from the start and save time by auto-applying favorite exit strategies from the start. As soon as an order is placed, the corresponding stops and limits will be automatically placed.
Make a strategy auto-apply to any new order created by double-clicking on its icon – a green checkmark will appear. Remove the auto-apply by double-clicking the icon again. Another nice feature is that auto-application may be paused by pressing Space or clicking the Pause button. Pausing can be very helpful if entering an order quickly without any additional exit orders, but it does not remove or change the standard order setup.
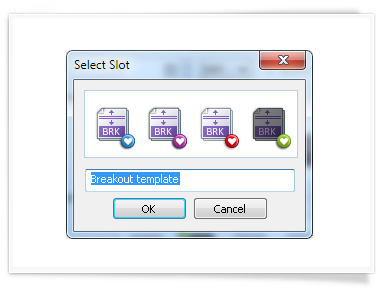
Save the settings as a template so orders can be fired even faster. Create up to 4 templates per strategy.
In other programs seeing a chart doesn’t mean you can trade from it, but in MultiCharts it’s always possible. Trade any symbol from any chart with symbol mapping.

How Symbol Mapping works
Define a path for your order to get to the broker, and to receive status updates back to your chart.
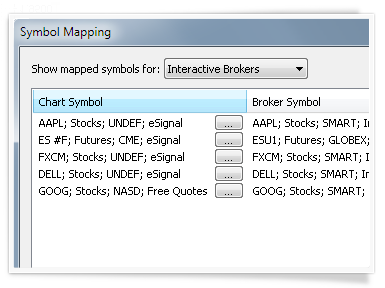
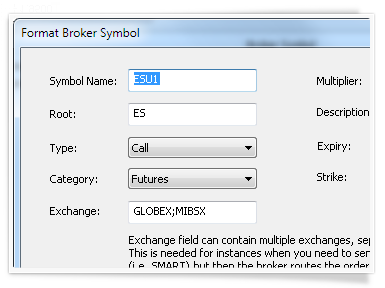
For example, if trading the E-mini futures, the broker may not provide the continuous futures symbol. However, it’s possible to find a data feed that provides a continuous symbol. You can mix different data providers and brokers in MultiCharts, but that can sometimes creates a discrepancy. The data feed may call the symbol ‘@ES’ or ‘ES #F’ while the broker is expecting an order for the ‘ESU1’ contract. Without symbol mapping traders would be limited to only using data from the broker being used to execute the trades.
Symbol mapping is a ‘translation’ tool that defines how an order will appear to the broker – even if @ES is the symbol on the chart, MultiCharts can make it appear as ESU1 (or anything else) to the broker. If the symbol on the chart matches the symbol used by the broker then this tool is unnecessary. Symbol mapping, though, is essential if using different data providers or brokers.
Forget about mismatching symbol names and exchanges, retain full control of order routing with symbol mapping.
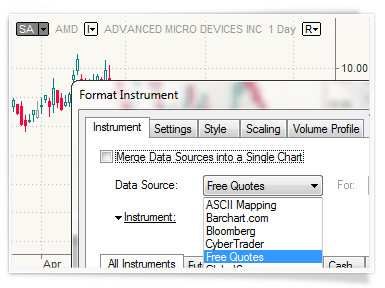
Combine historical data with real-time data from different sources
For example, Google, MSN, and Yahoo (combined under the name Free Quotes in MultiCharts .NET) offer free historical daily data. You can make a chart using this data source and merge it with real-time data from Interactive Brokers.
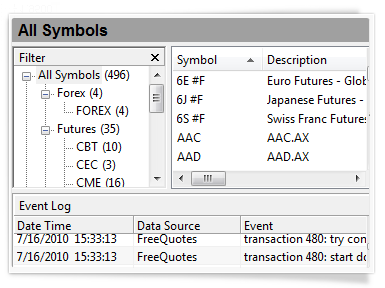
Symbol Lookup is a very convenient tool provided by some data feeds (not all). These lists allow you to search for a symbol by a part of its name or its description. The data vendor will then show you all matching symbols, and you can add the ones you need to your database.
You can add symbols manually
Some data providers that MultiCharts supports don’t offer this feature. This means you will have to add each symbol manually. You will need to input the symbol name, data source, category, and exchange that match data feed specifications—so that MultiCharts knows which data to request and where to get it from. You can get this information on the data feed websites.
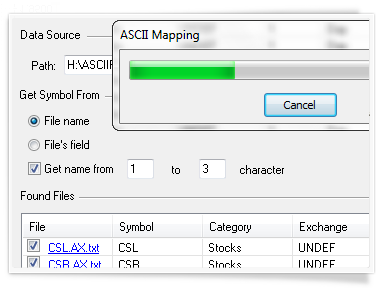
ASCII files are text files with quotes from third-party data sources. ASCII mapping is different from ASCII import. Import is a one-time update, and it has to be done manually. MultiCharts ASCII mapping feature will automatically update your charts whenever the text file is updated with new quotes.
Map symbols with ease
First, you indicate the file path and the file format for each symbol; this is called mapping. Every time you create a chart with a mapped symbol, MultiCharts automatically calls up the file, and plots the data. This feature is particularly convenient when working with a large number of third-party data files.
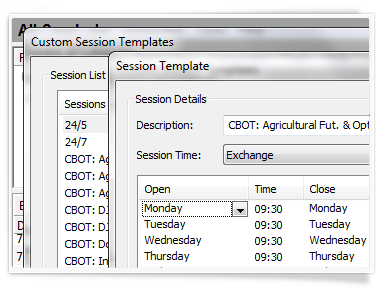
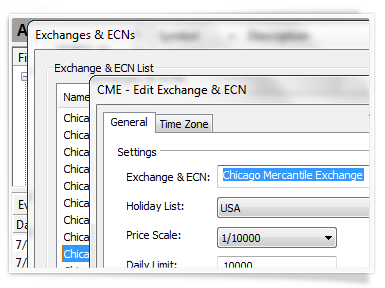
MultiCharts comes with many pre-configured session templates for most major market sectors. However, if the one you need is not in there, you can easily add it yourself.
Change session templates
Symbols have session templates applied to them, by default, based on the exchange where they are traded. You can change the session template at three different levels—chart level, symbol level, and exchange level. When you change the session template at chart level, it will only affect the chart you have in front of you, and that’s it. In Quote Manager, you can edit a symbol to use a custom session template—these changes will affect any chart you create with that symbol. Alternatively, you can change the session template for the entire exchange, which will affect all symbols on that exchange.
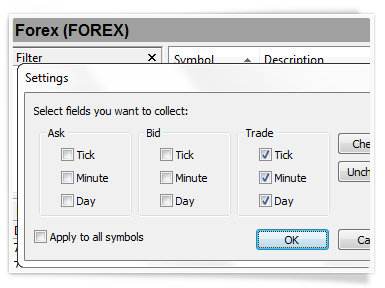
Usually data is only loaded and stored in the local database when you make a chart. This type of on-demand data loading prevents your computer from becoming congested. However, the QuoteManager can collect real-time data for symbols that you choose and store it locally, even without making a chart.
Build your own historical data
This is useful when there is no immediate need to plot the symbol, but the symbol’s data must still be stored. A good example is when your data feed does not provide historical data, so you need to build up your own supply. The stored data can be used later as historical data for creating charts.
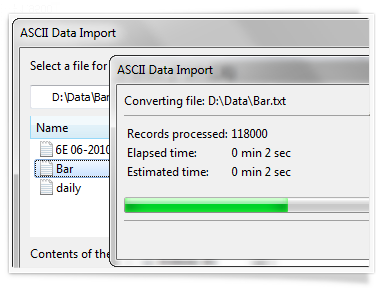
Data is often provided in the form of ASCII (text) files. MultiCharts can import third-party ASCII files and export locally stored data into the ASCII format.
Select your own data format
There are often slight formatting variations in ASCII files from different providers. For example, some use commas for separating information, while others use semicolons. MultiCharts can automatically convert most formats, but not all. For those rare cases, when MultiCharts does not recognize a format, you can easily select your own.
You can use default settings for sessions or customize details such as price scale, time zone, big point value, and minimum price movement.
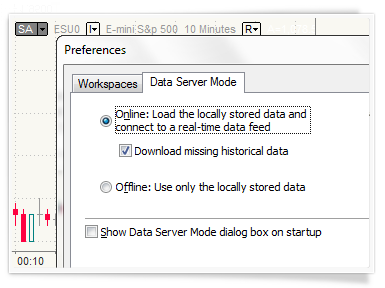
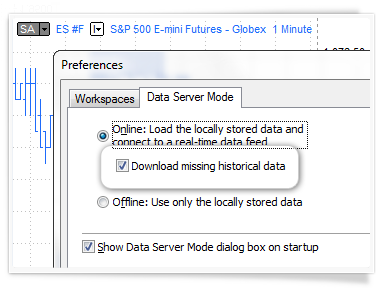
The usual mode is online, which means MultiCharts downloads missing historical data from data feeds. However, you can choose to work offline if you don’t have an internet connection—or for testing purposes. In the offline mode, MultiCharts will use locally stored data, and you can use it to work on strategies and perform chart analysis.
Any gaps in the locally stored data are automatically filled by downloading missing historical data from your data feed. The process is highly efficient because it only grabs the data you need, as opposed to reloading all data for the entire period. This feature can also be disabled if you don’t want to use it.
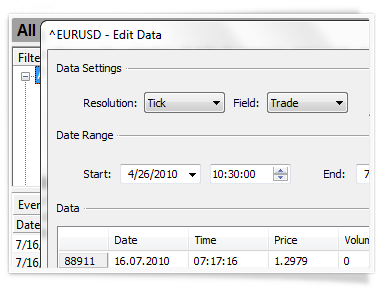
The locally stored data can be viewed and edited. For example, you can find and correct bad ticks quickly and easily. You can also add new data or delete existing data from your system.
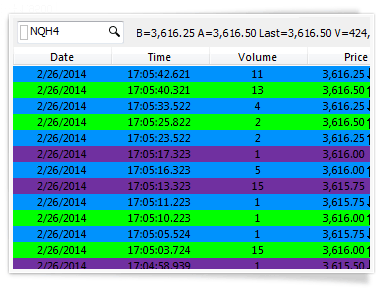
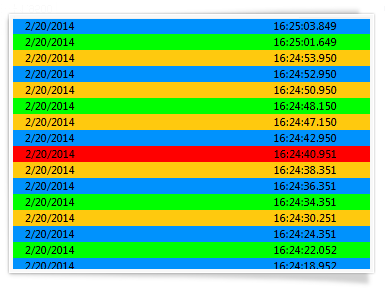
There are 100,000’s of transactions each day and and a trader needs a tool that is capable to filter noise and to aggregate the information for decision making.
Full picture of the market
You can use the “Aggregate Ticks with Similar Price” option which combines all trades with the same price and direction into one line.
Refresh as often as you like
If you have a powerful computer then you may want to choose updates every 1/10th of a second. Reducing frequent updates helps reduce the load on your CPU.
Choose update direction
For your convenience we implemented an option to where to add new lines: on Top or Bottom. The latest data will always be in front of your eyes.
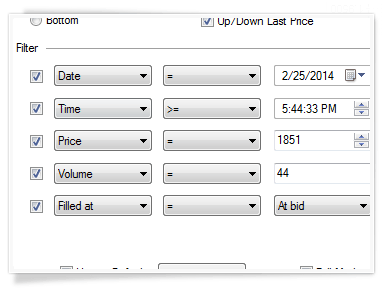
Filter trades by time, price, volume and/or Filled At/Above/Below/Between Bid or Ask. You can use one or multiple filters to see exactly what you need right away.
Easy access to your filters
We designed a special Filter button on Time & Sales window that lets you turn on/off filtering with one click. You can set up filters once and then activate whenever you need them.
Set up the desired number of rows, choose windowed or fullscreen mode, add more info to the status bar, and set up colors for data grouping.
Save space with Compact Mode
Organize your working area just the way you need it. Time & Sales has a Compact Mode to save on space, or you can go Full mode on a larger monitor. Easily switch by clicking the Switch Mode button.
Pause the flow when you need
Don’t miss a thing with our AutoPause feature on Time & Sales. Simply left-click anywhere on the window or scroll, and updates will pause to give you time to analyze the situation. Click the window again or scroll back to where you were to resume real-time updates.
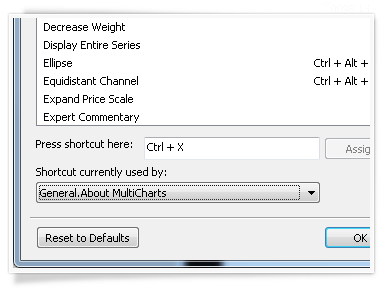
From opening a new window to placing complex strategies, you can make a shortcut for it. Cut down time navigating around and do what you need quickly.
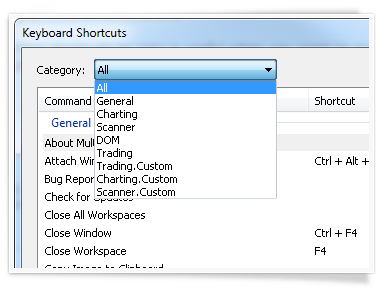
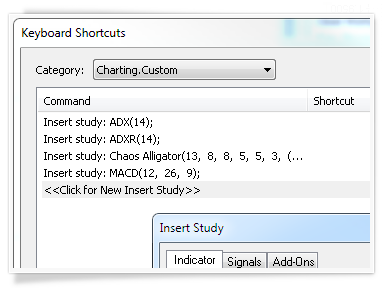
Setting shortcuts to sets is useful when you want to quickly analyze the market from different angles. Hotkeys let you efficiently flip through different sets of studies.
Placing an order at the exactly the right time is an essential part of successful trading. Hotkeys lets you strike exactly when the time is right, even with complex sets of orders.
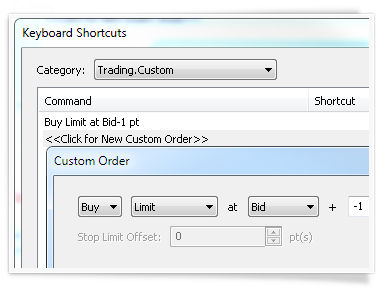
If regular actions are not enough, you can easily assign combinations of your favorite actions into bundles. Assigned hotkey will then perform multiple actions at the same time.
