
CME Group 1-Ounce Gold (1OZ) Futures is Now Available for Live Trading!
CME Group 1-Ounce Gold (1OZ) Futures is Now Available for Live Trading! CME Group smallest Gold contract yet, only...

Overcharts allow you to easily toggle between brokers or simultaneously connect several brokers and data feeds.
Different broker and data feed (historical and real-time) for each instrument.
You can easily switch your favorite broker without changing your trading and your analysis method, just configuring the connection.
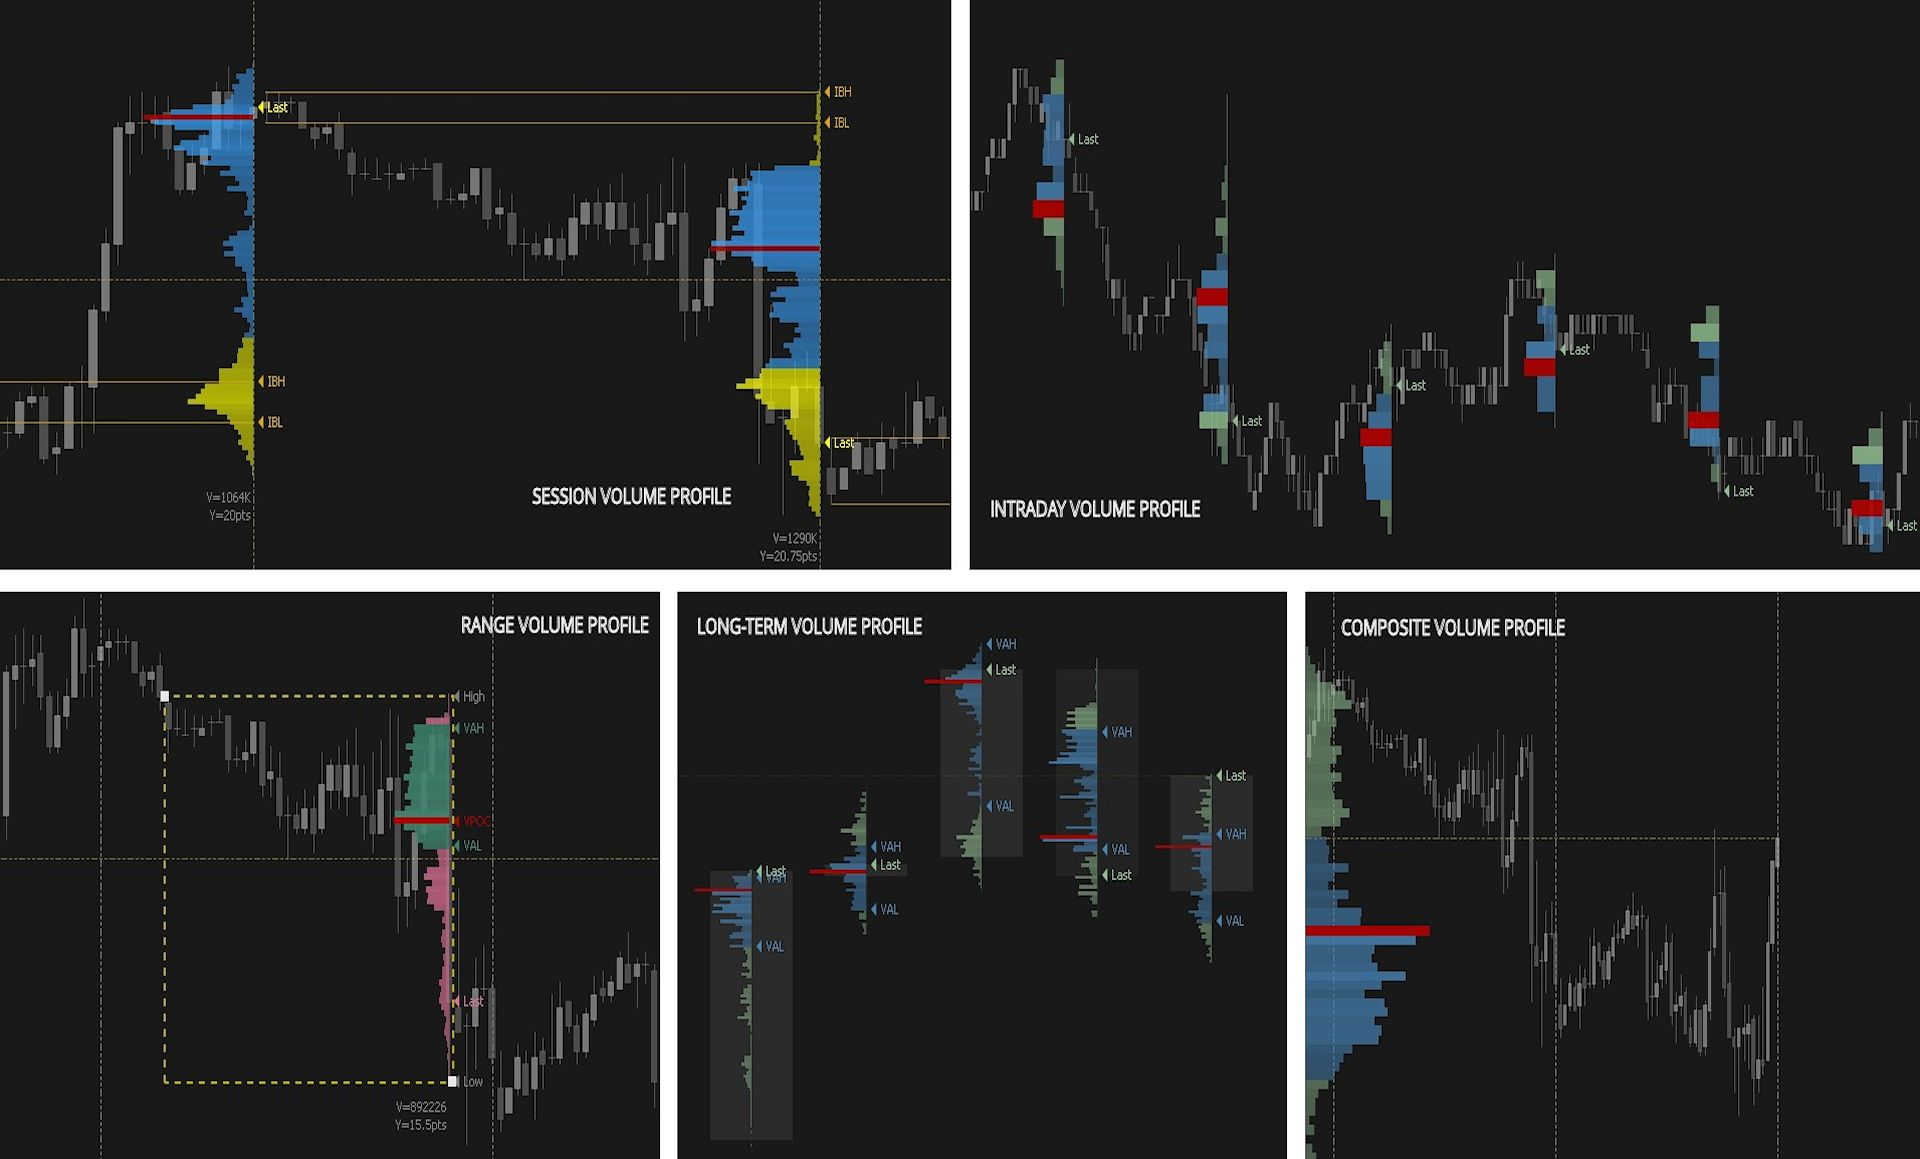
The tick/volume analysis package includes a series of indicators and tools that are essential to understanding market movements in advance. For example, Volume Profile shows the volume traded at particular price levels, highlighting if there are more buyers or sellers.
Available: Volume Profile (intraday, session, composite, range, day, weekly, monthly, and additional column on DOM), TPO Profile, Volume Delta, VWAP, Volume Meter, Volume on Bid/Ask, Session Statistics and more.
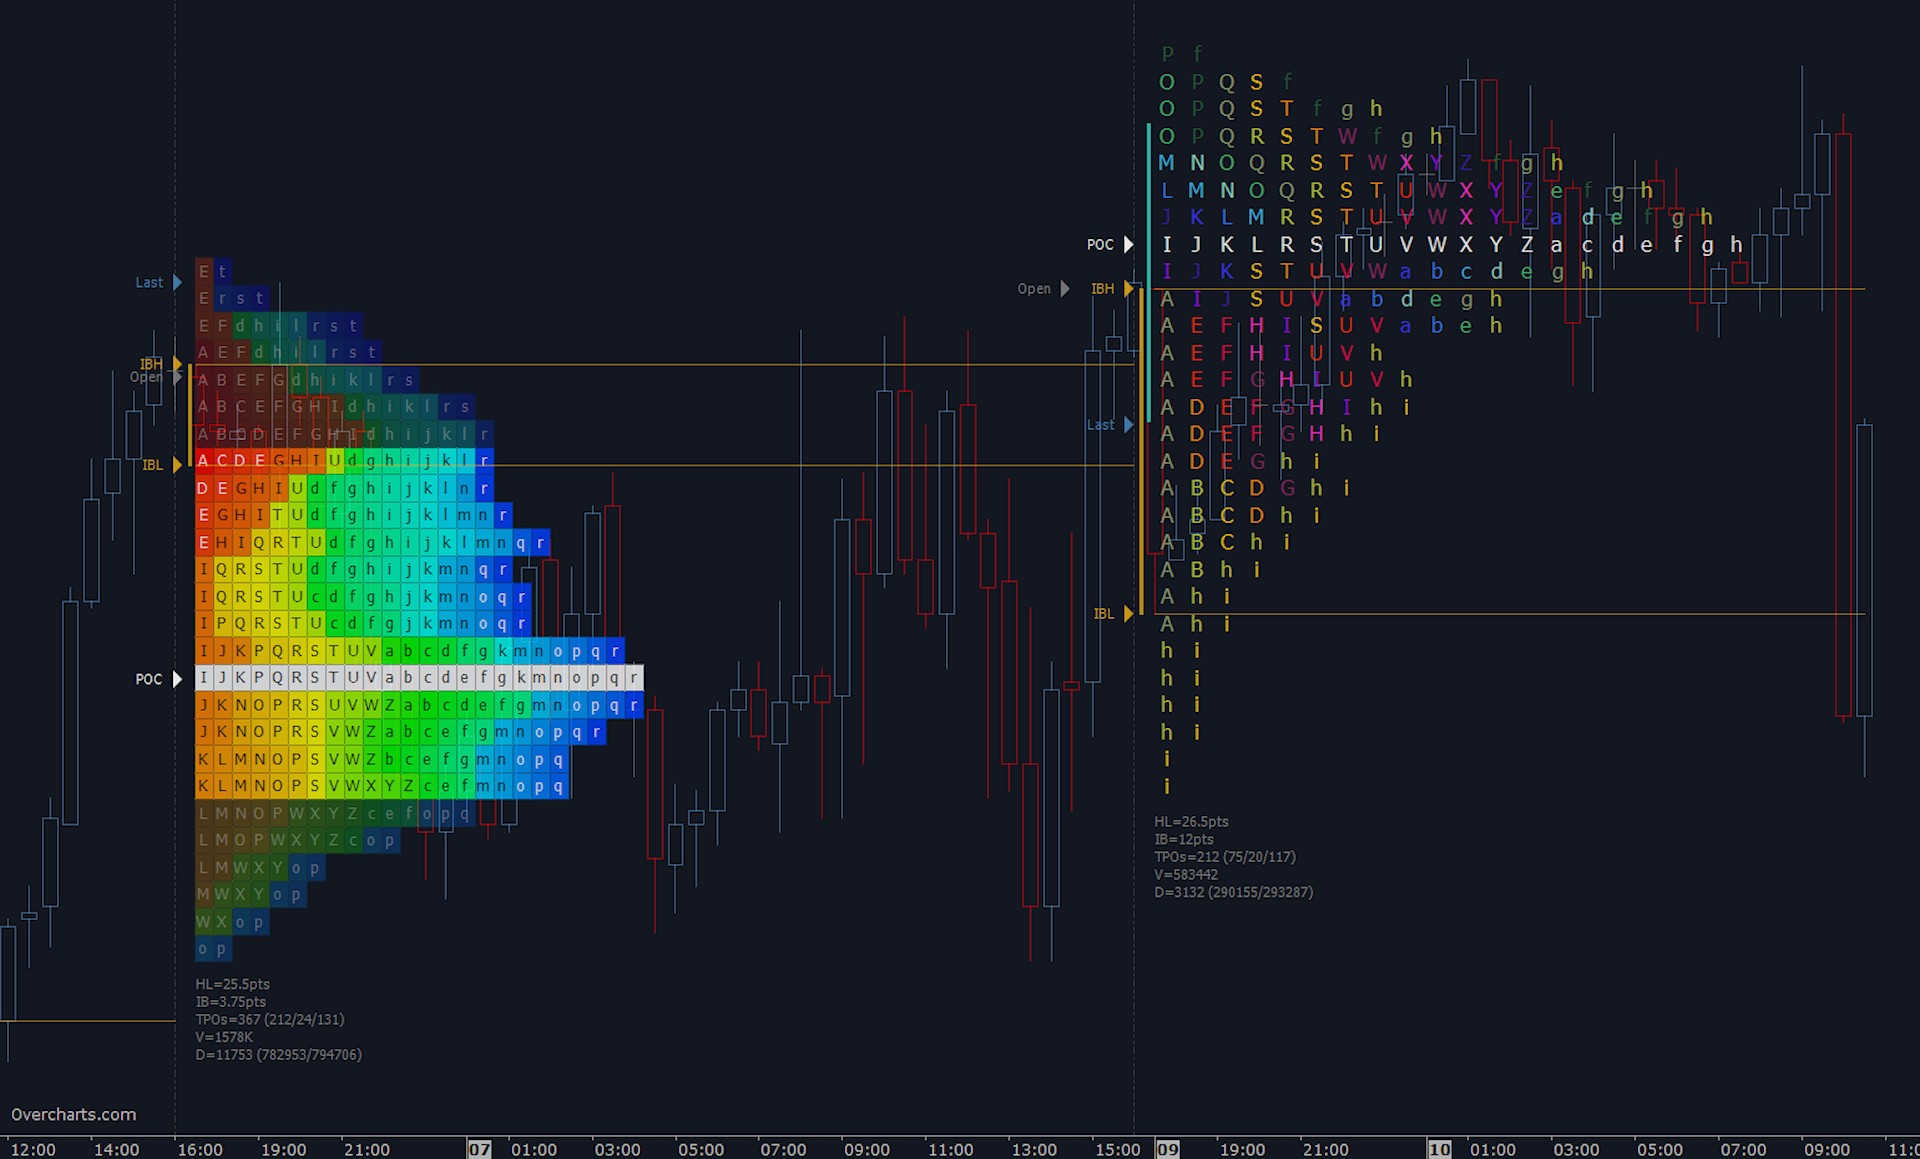
TPO Profile (a.k.a market profile®), is similar to volume profile. Time-Price-Opportunity (TPO) shows the price distribution during the specified time and highlights at which levels the price has spent the most time.
TPO profile is generally used in conjunction with volume profile to better identify areas of support and resistance.
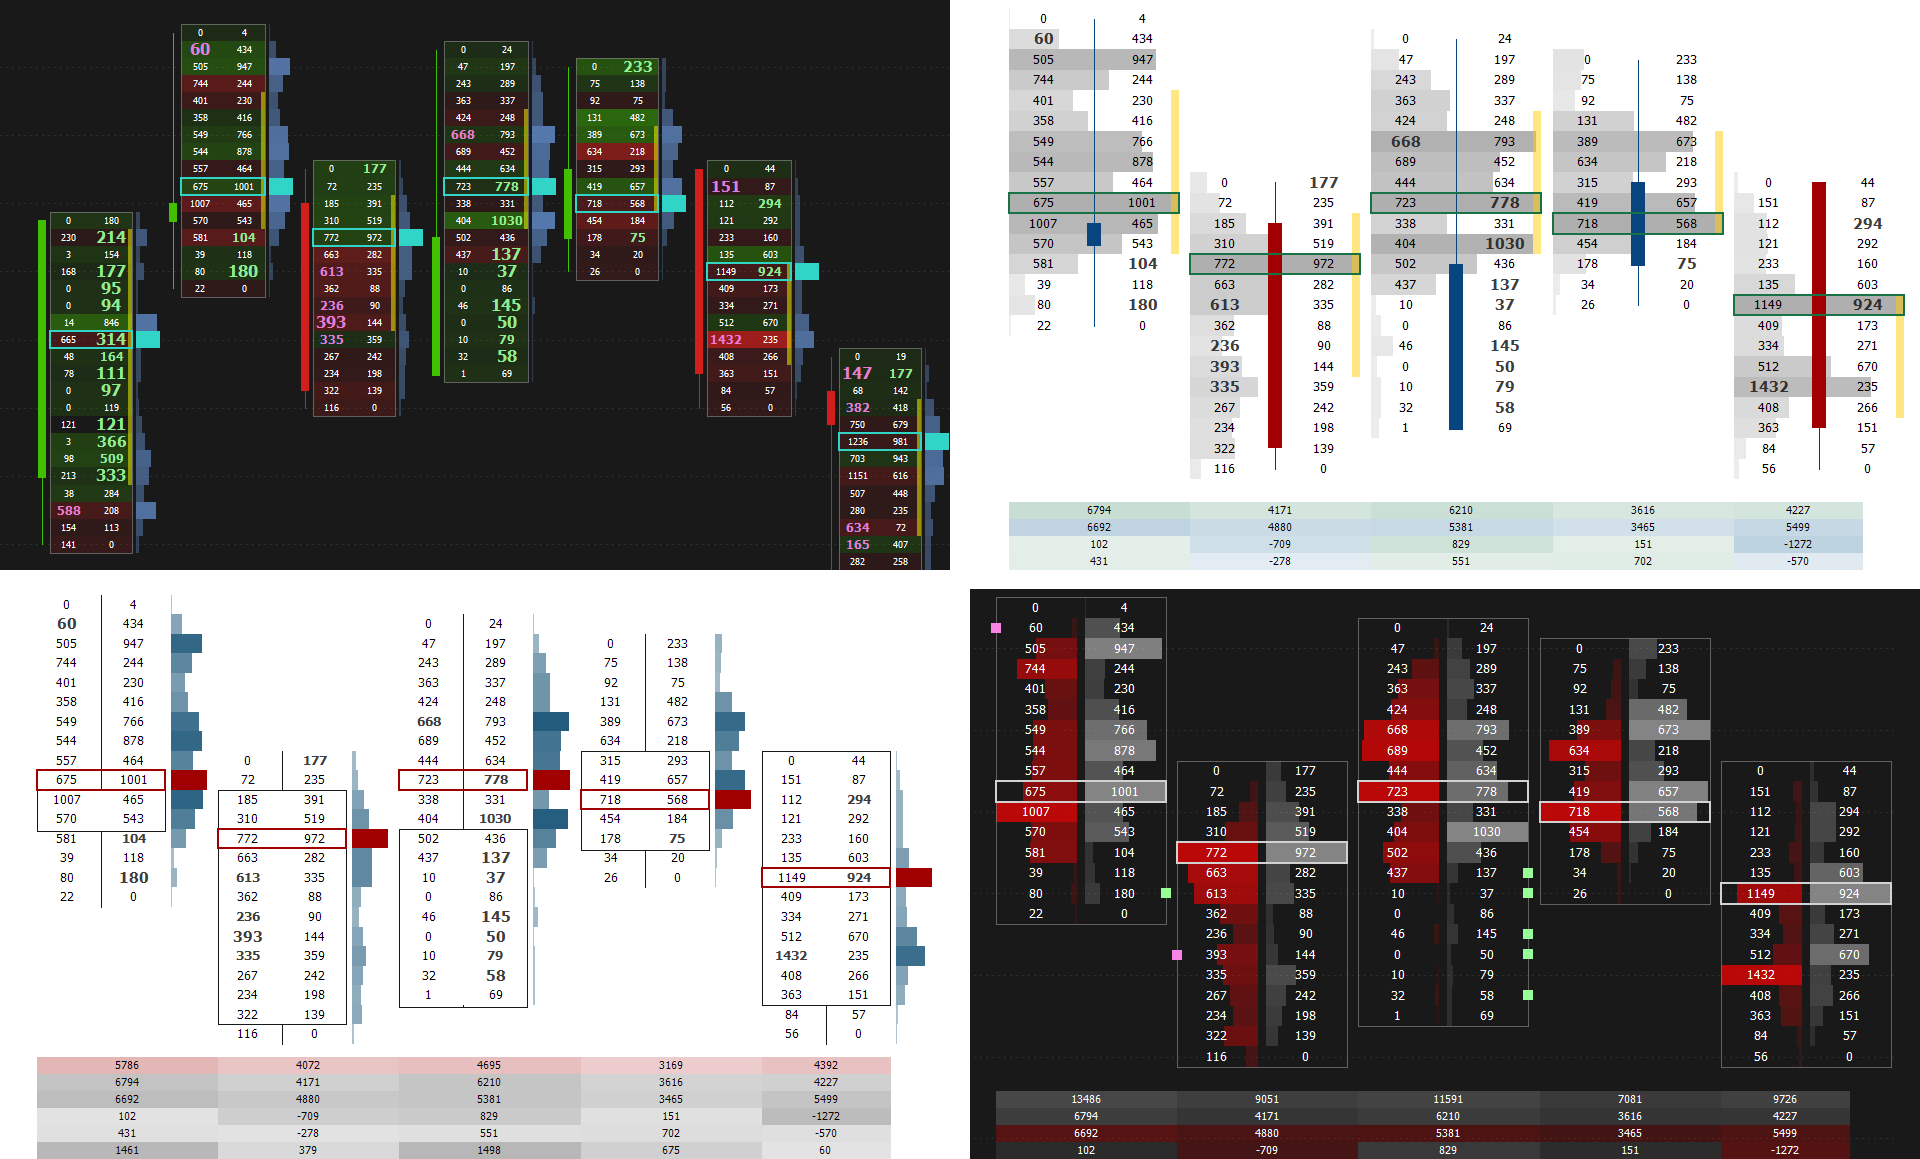
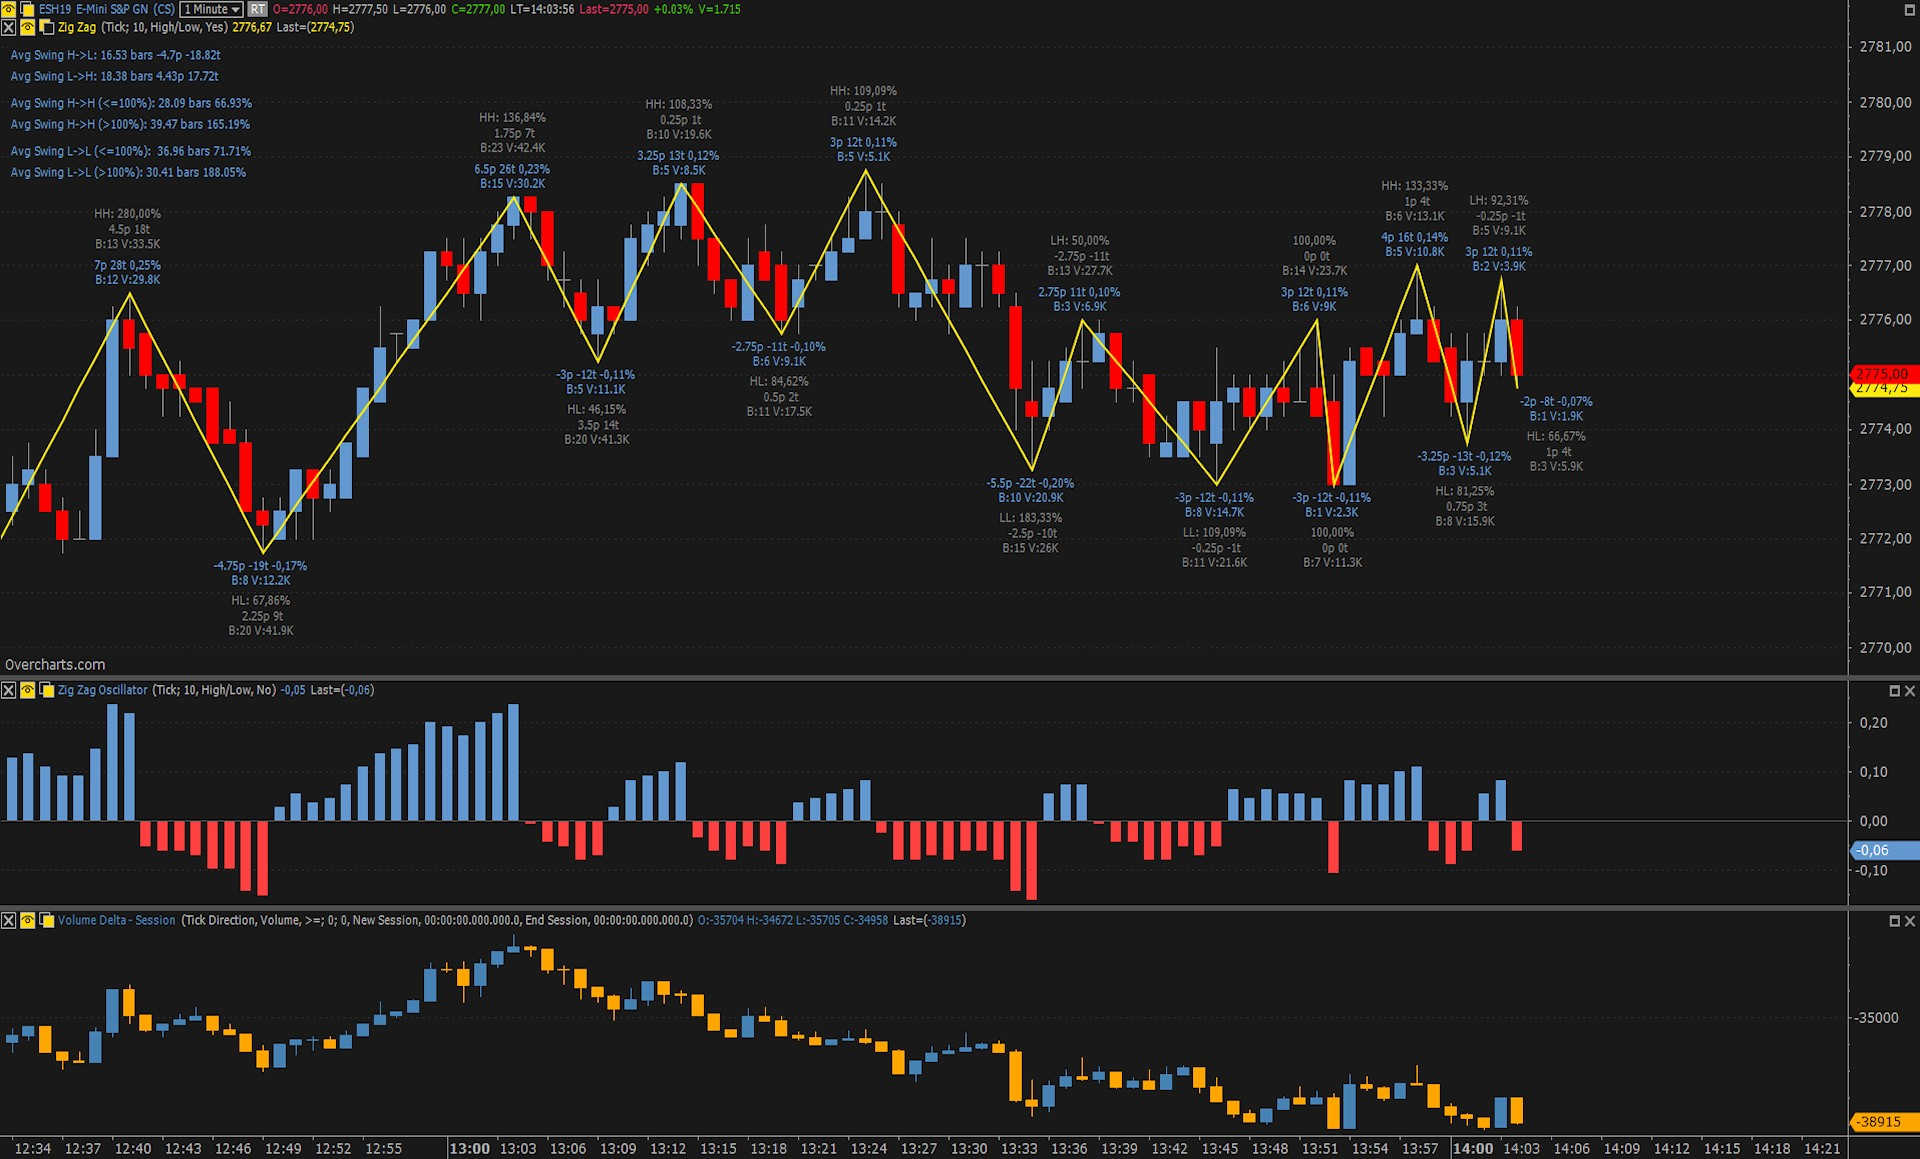
The Volume Ladder (aka footprint) is one of the most important indicators of order flow analysis. It displays Volume, Bid/Ask, Delta and other volume statistics together inside each bar.
Unlike traditional bar or candlestick charts, the volume ladder combines Price, Volume and Order Flow all in one. Acceleration, deceleration, absorption, bid/ask volume levels, delta and lots of other information into a single intuitive chart.
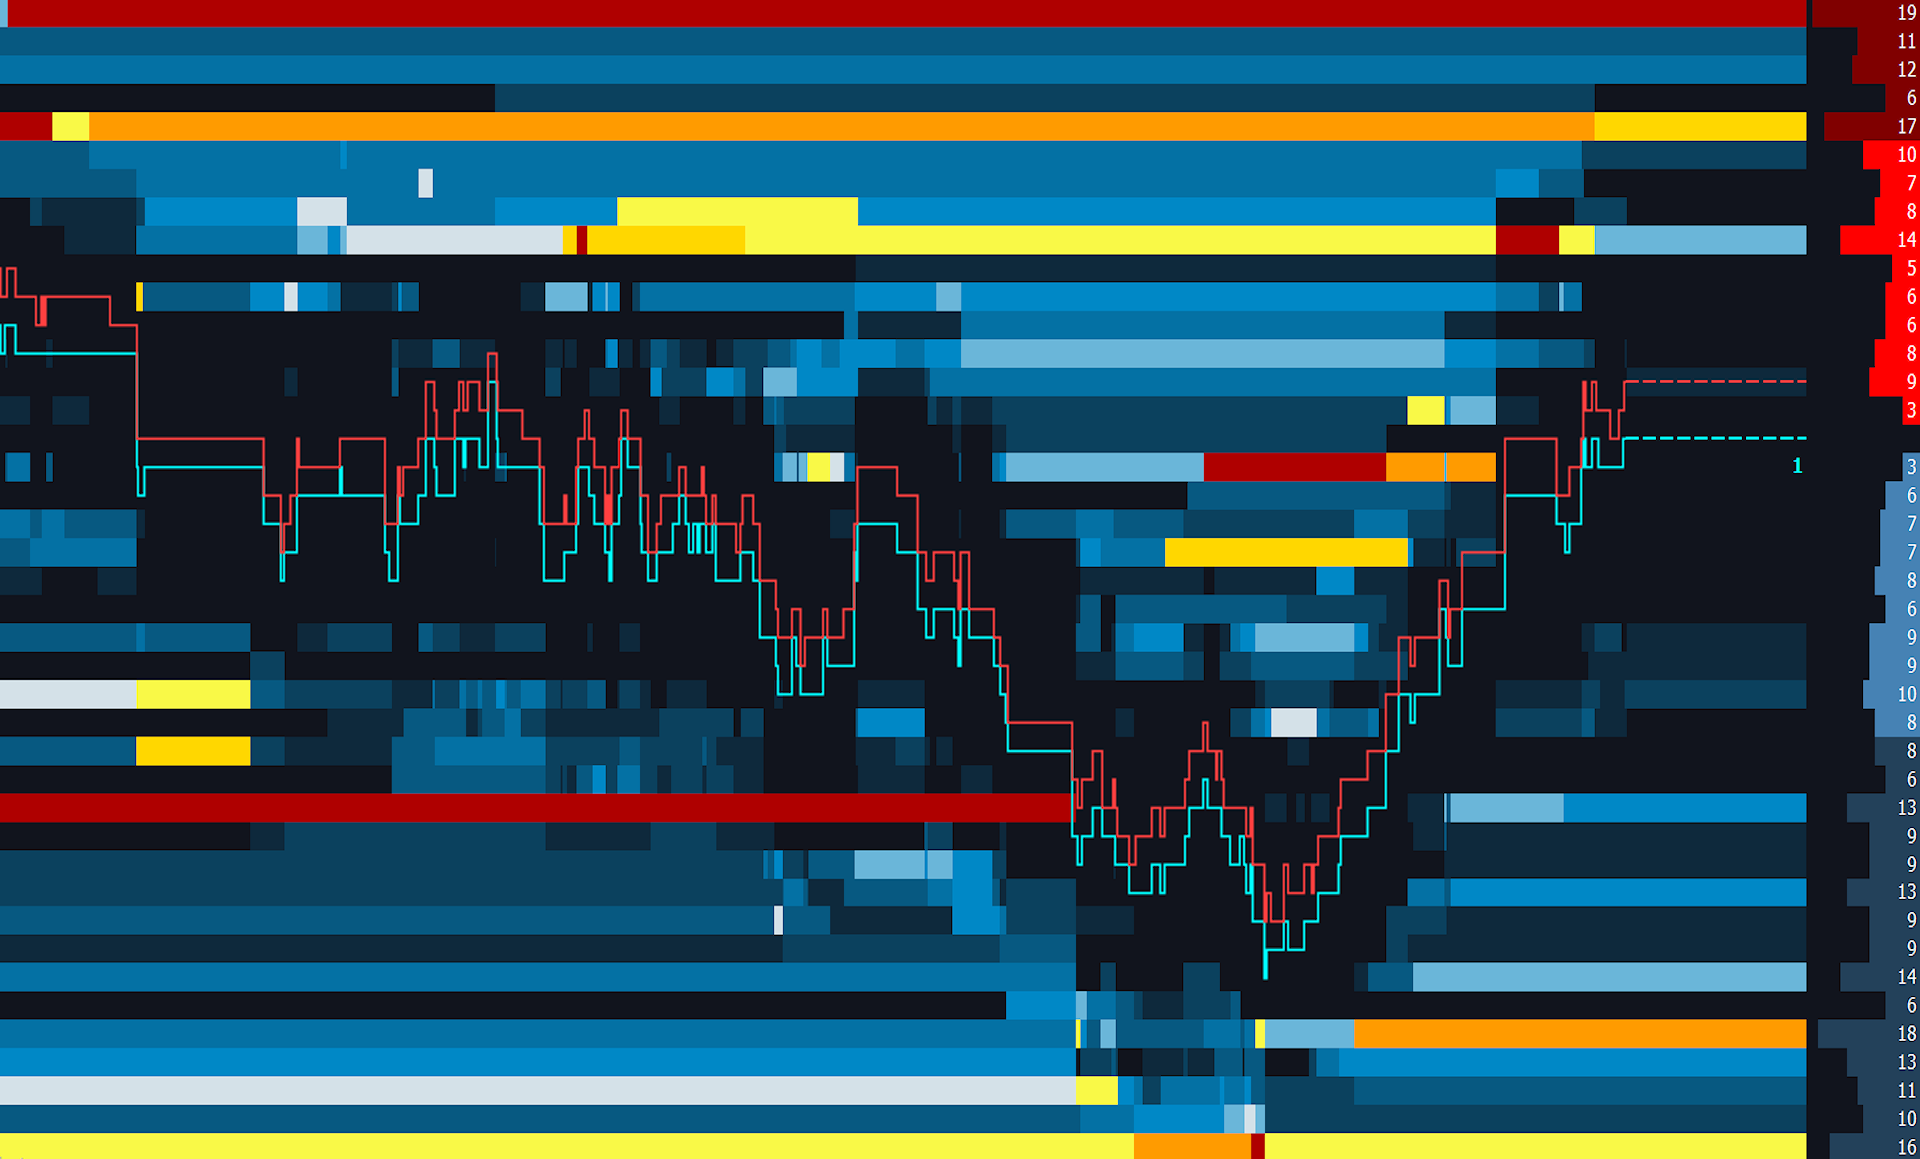
More and more traders are using Market Depth while conducting volume analysis. Its main function is to help traders identify potential levels of support and resistance.
The indicator only works in real-time with limit order book (DOM data). Initially this indicator does not display historical data. Overtime, as the indicator is running, real time data is collected and displayed on the screen. The color of each price level changes according to the number of orders sitting at that particular level. The higher the volume, the greater the intensity of the color. This type of coloration, also called a heatmap, is very efficient in identifying potential levels of support or resistance.
Organize your trading and chart analysis into multiple workspaces. Overcharts uses intensive multi-threading for chart calculation and refresh. This means that each workspace is updated independently and at the same time.
Each workspace can be placed in a different monitor and contain different DOMs, Watchlists, Time & Sales, Charts, etc.
* Performance on 64-bit operating systems and multi-core processors.
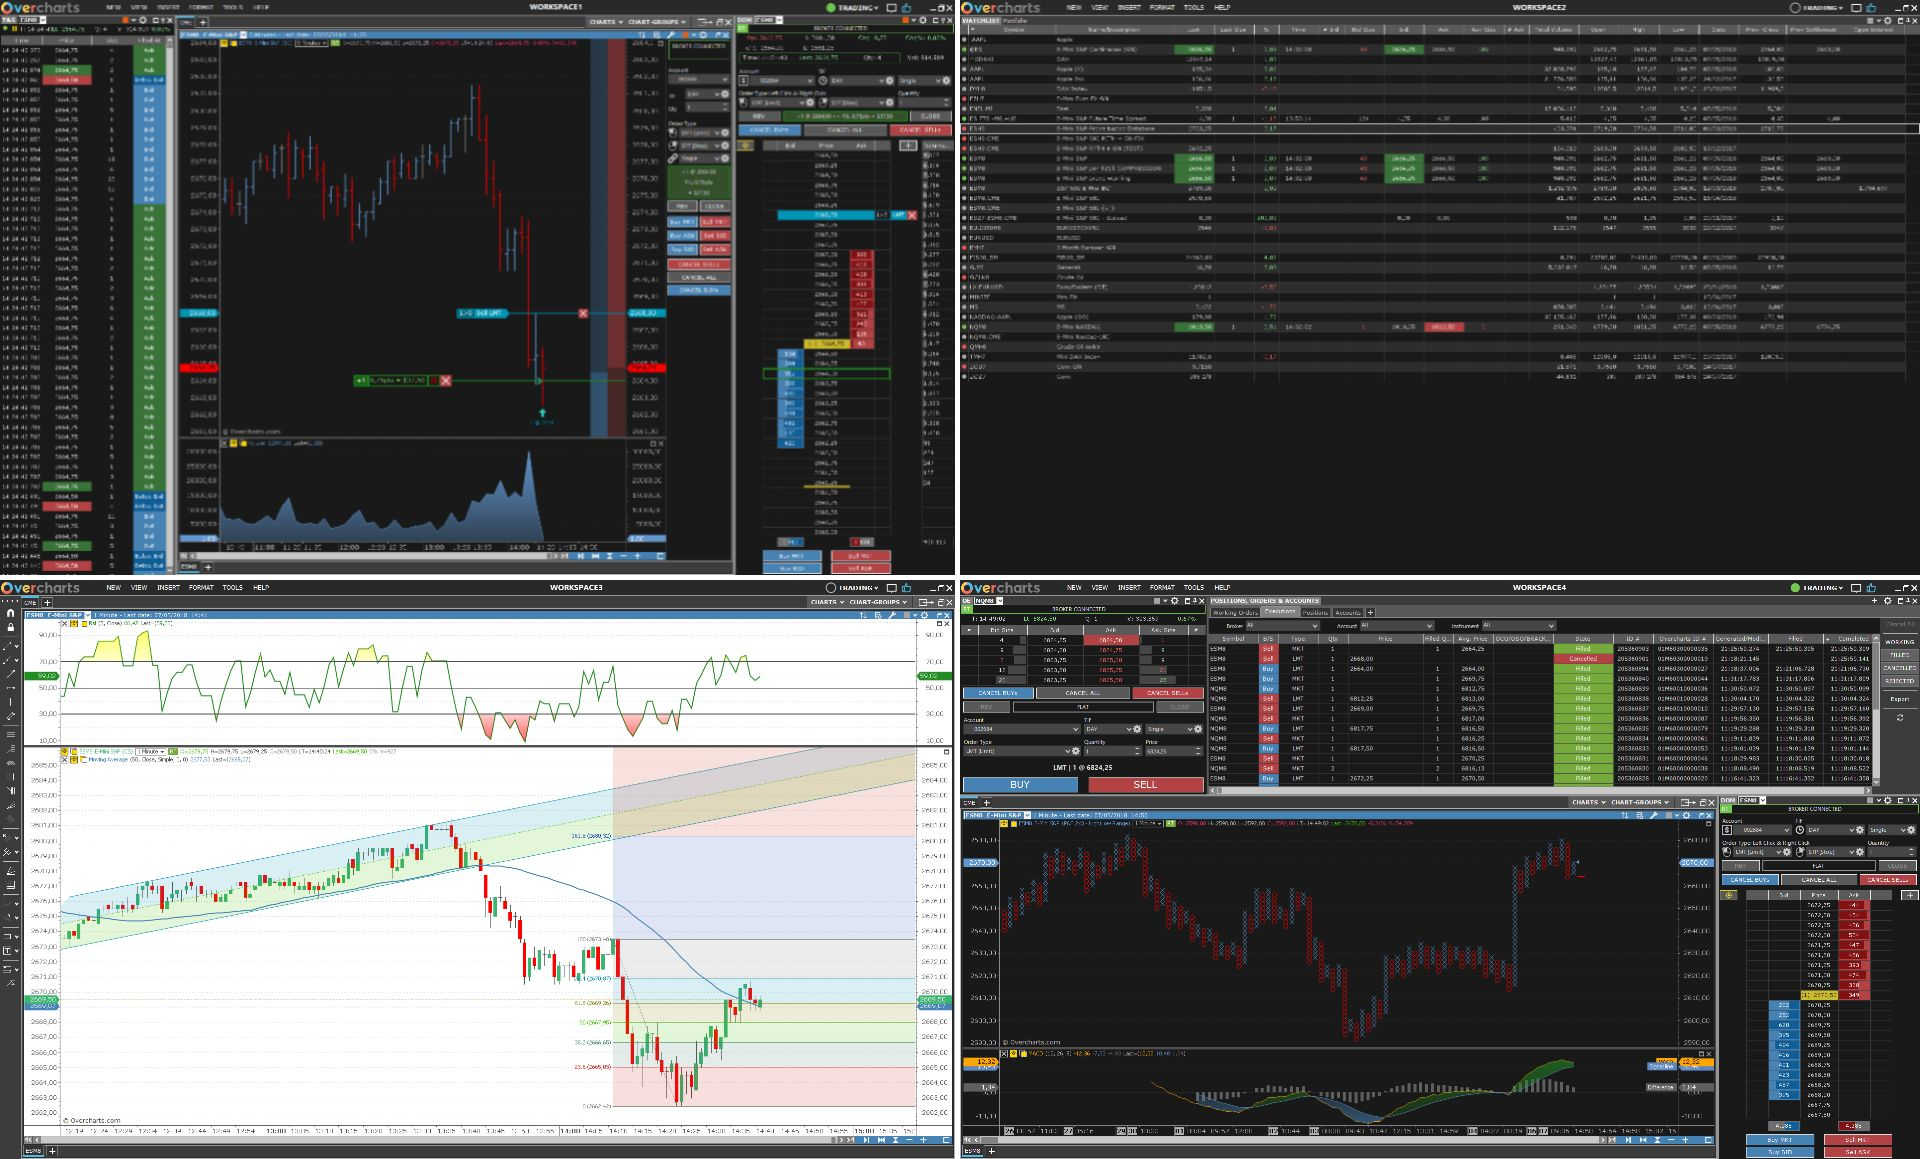
With a 4k Ultra-HD graphics engine, Overcharts offers the ability to make the clearest and most immersive trading experience ever. Analyze the market with many different types of charts, such as Candlestick, Bar, Line Equivolume, Candlevolume, Point & Figure, Kagi, Renko, Three Line Break, Heikin Ashi, Dot on Close, Volume Bar, Range Bar, Reversal Bar and Trend Hollow Candlestick. Overcharts also has all common indicators available that can be plotted on the charts, along with the ability to plot charts of other instruments on top of existing data with any resolution.
Each chart (or data series) can display up to 100 million bars on a 64-bit operating system.
Advanced Drawing tools are available: Trendline, Fibonacci, Elliott, Pitchfork, numerous Channel types, Measurement tools and many others.
