
CME Group 1-Ounce Gold (1OZ) Futures is Now Available for Live Trading!
CME Group 1-Ounce Gold (1OZ) Futures is Now Available for Live Trading! CME Group smallest Gold contract yet, only...

VolBook®is a professional volume trading platform that offers an innovative way for the display and the analysis of the market depth without neglecting the study of level 1.
We have made a huge effort in order to build the heatmap with the property display algorithm.
The heart of the platform is the market depth analysis through a heatmap where each price level changes color based on the amount of limit order placed at that level, helping traders to identify support and resistence book zone and where the markets is going to because the price goes up and down searching the liquidity in order to execute orders.
It would be impossible to analyze it on the common vertical book and you would lose what happened on the post and how the liquidty has changed at that level.
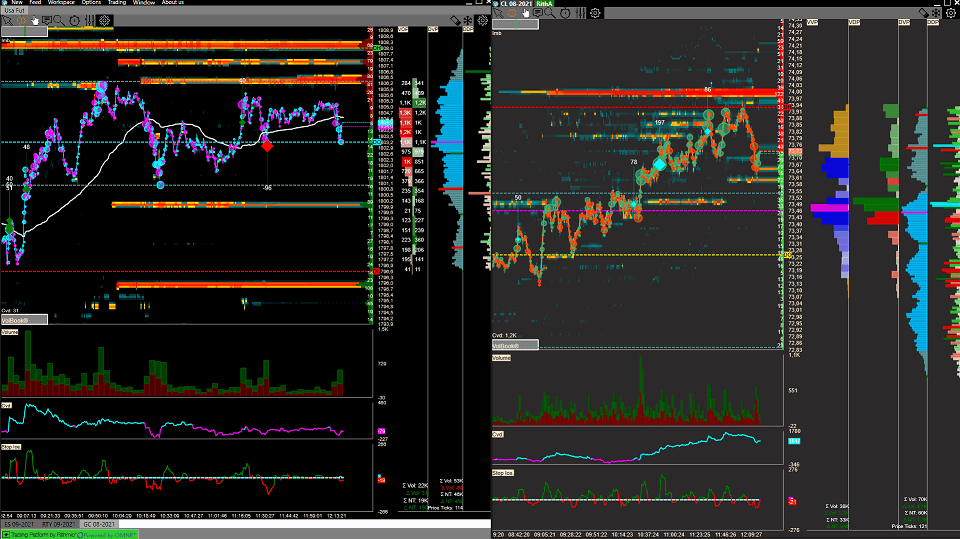
VolBook® supports the full depth where it is available, so it is possible over than 1000 levels and it is really important for this kind of analysis; we also offer the historical depth of the day. Volume profile is one of the most powefull volume indicators becuase it highlights the most interested zone of price and how they were executed thanks to the delta profile.

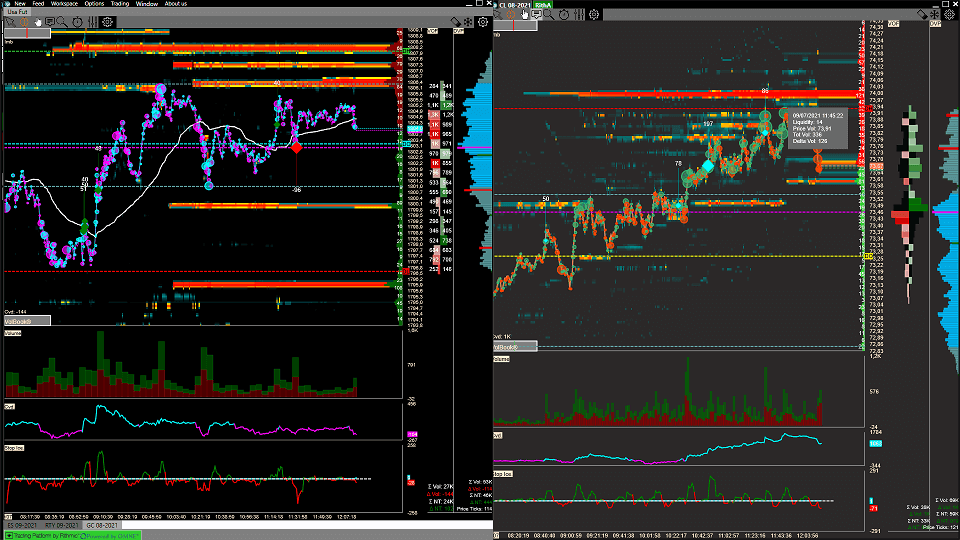
VolBook® combines the analysis of the level 2(market depth) with the level 1(time and sales) thanks to the volume bubbles indicator. The trades are displayed as bubbles which size depends on the amount of volume executed and which is the aggression(buyer or sellers)
This function allows you to identify the book action like spoofing, layering or when the limit orders are really executed; the indicator is fully customisable in terms of colors, filters, grouping mode and so on
Volume profile is one of the most powefull volume indicators becuase it highlights the most interested zone of price and how they were executed thanks to the delta profile.
The abilty to read the profile is one of the most important key for a successfully market analysis with the volume and it is also not so easy, because when we see a profile, you should be also to identify the shape of the distribution, unbalanced zones, pseudo point of control(POC) and many other things.
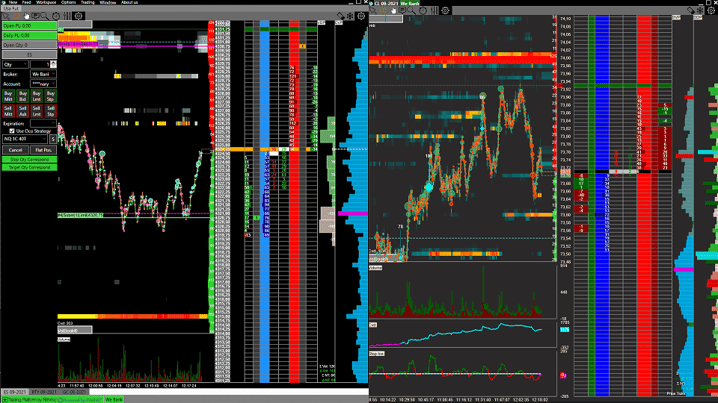
To help scalper traders we have thought a tool, called Chart Dom. which allows traders to insert orders in a very fast way; it is not just an order submission, but it also analyzes pull and stack order and executed one.
Chart Dom allows traders to place limit order (left mouse click) and market order (right mouse click) with only one click.
VolBook also supports Oco Order Strategy, in which way you can break your position in small pieces, putting multiple stop and target orders.
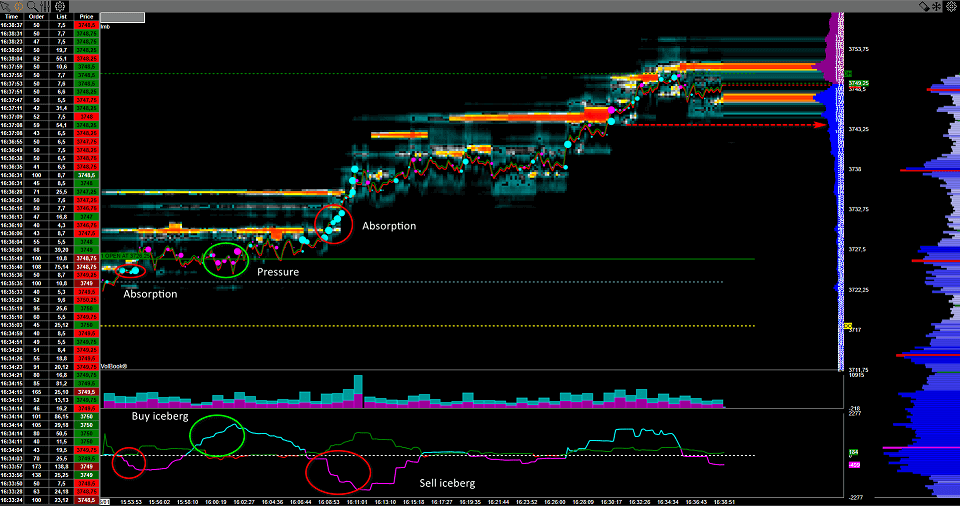
Thanks to the market by order (MBO), VolBook® can recognize executed iceberg and stop orders in the market, highlighting interesting moments.
Iceberg orders are native iceberg and they are available on CME Group with Rithmic data feed, while in the italian stock market we have developed an algorithm in order to detect them with VolRT.
Stop orders are not native because the market doesn’t send that kind of informations, but they are detected thanks an algorithm.
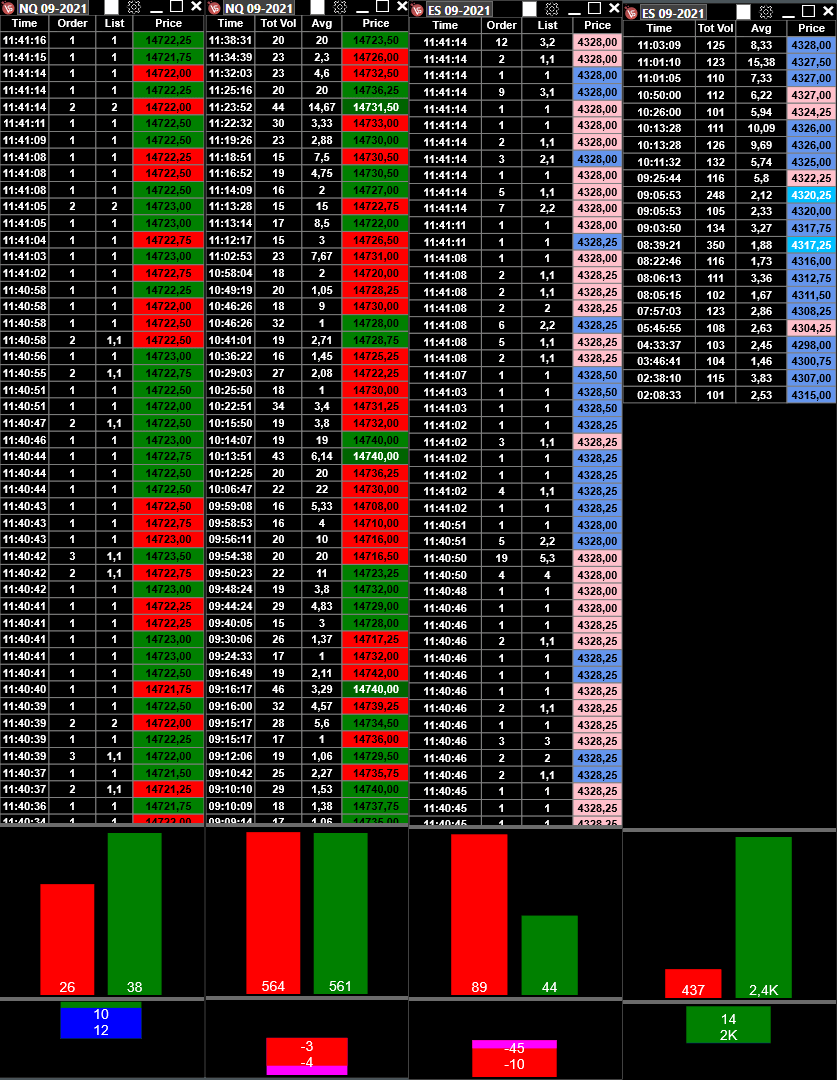
Starting from late 2009, you have almost never seen the real size of the executed orders in the ordinary time and sales which is available on the most known platforms like NinjaTrader or MultiCharts; thanks to the improve of the technology and the speed of the netowrk, almost every large market order/trade is broken into small pieces, so it has become very complicated to identify them.
For example, a 200 lots market order can be displayed in your ordinary tape in many individual prints and it would impossible to rebuild the original order.
Our version of tape (Advanced T & S), combines individual prints back together (the way it used to be before 2009) so that you can easily see the actual market orders to their full extent and it allows you to filter the size of ther orders so you easily sense what the bigger/smaller traders are doing at the moment
It is also possible to enable relative sound alarms with the possibilty to show some other essential information including Iceberg Orders and Quantity Order entered associated at the trades executed.
